What has happened to non-COVID mortality during the pandemic?
6 December 2021
Key points
- In England, deaths from causes other than COVID-19 have been lower than usual for 80% of the pandemic. In January to September 2021, this was equivalent to about 34,000 (or 9%) fewer deaths than we would expect, based on historical mortality patterns. This analysis explores some of the questions arising from this reduction.
- Some of this reduction can be explained by ‘displaced mortality’: people who would have died from another cause, but died earlier from COVID-19 instead. But this cannot account for all the difference. If people dying from COVID-19 were typical of their age, around 9% would have died from another cause in the following 12 months – around 8,500 people. Even if these people were more likely to die than typical of their age, this would still not account for anywhere near the 34,000 ‘missing deaths’.
- During the pandemic, deaths from eight of the nine leading causes of death in England were lower than usual. The greatest reductions in percentage terms are for influenza/ pneumonia (48%) and chronic lung conditions (25%). As well as displaced mortality, reductions here are largely due to the lower prevalence of infectious diseases as a result of restrictions such as social distancing. The reasons behind reductions in deaths from stroke, heart attacks, angina and cancers are less clear.
- Understanding these changes is challenging because multiple factors act to change mortality risk in different ways – with some impacts seen immediately, and others taking time to emerge. To help researchers and policymakers try to make sense of this, we propose a model to illustrate the impact of these different factors.
- We apply this framework to analyse deaths from lung cancer, which have been 7% lower than usual. We conclude that this reduction is likely not a ‘true’ reduction (as the risk of developing lung cancer during the pandemic is unlikely to have changed). Instead, these are probably due primarily to the reduced diagnosis of lung cancers, with some reductions due to displaced mortality. In the longer term, we may expect an increase in lung cancer deaths given these delays in diagnosis.
- Policymakers and researchers should be wary of drawing quick conclusions about the pandemic’s effect on our health – and should instead, for each condition, unpick the complex threads of displacement, the recording of deaths, and any changes in risks.
The table below shows the number of excess deaths by COVID-19 and from all other causes from 1 March 2020 (taken as the statistical start of the pandemic) to 31 December 2020, and from 1 January 2021 to 30 September 2021. This shows that, for the 2021 period (for which the recording of COVID-19/non-COVID deaths is more reliable), excluding deaths from COVID-19, there have been 34,000, or 9%, fewer deaths than would normally be expected.
We use the 2021 period for the remainder of this analysis as it means we avoid the recording issues experienced in the first wave of the pandemic. Since COVID-19 is a novel virus, all deaths caused by COVID-19 are classified as ‘excess’ as none have occurred in previous comparator years.
Excess deaths by cause for different periods of the pandemic, England
| Period of the pandemic | Deaths caused by COVID-19 | Excess deaths from other causes | All excess deaths |
|---|---|---|---|
| 2020: 1 Mar 2020 to 31 Dec 2020 | 72,923 | 572 | 73,495 |
| 2021: 1 Jan 2021 to 30 Sep 2021 | 51,716 | -33,864 | 17,852 |
| 1 Jan to 31 Mar 2021 | 44,355 | -21,871 | 22,484 |
| 1 Apr to 30 Jun 2021 | 1,182 | -9,141 | -7,959 |
| 1 Jul to 30 Sep 2021 | 6,179 | -2,852 | 3,327 |
Source: Office for National Statistics (table 13)
So why are there 34,000 ‘missing’ non-COVID deaths? An obvious hypothesis is that some of these 34,000 people died from COVID-19 instead – the mortality was therefore displaced, occurring earlier than it otherwise would have. We see a similar pattern after a ‘bad flu year’ – there are often fewer deaths among older people in the post-winter months as some died earlier than would be expected from flu.
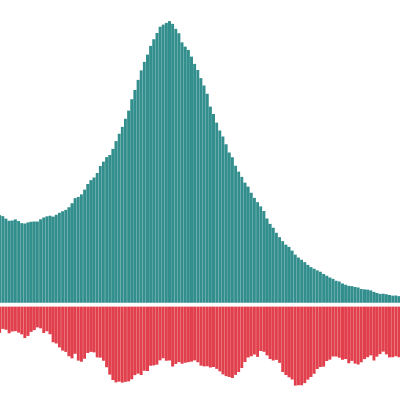
Certainly, some of the people dying from COVID-19 would have died within the next year. The figure below illustrates this for 1,000 85 year-olds in England (a little above the median age of death from COVID-19). Using historical age-specific mortality rates, it projects how many would die in each subsequent year. It shows that if those dying from COVID-19 were typical of their age, we would have expected 90 of these 1,000 (9%) to have died from other causes in the subsequent 12 months.
If we apply this approach to the people of each age who have died from COVID-19 , we estimate that of the 125,000 people dying from COVID-19 in England, around 8,500 (7% of the total) would have died from other causes in the first 9 months of 2021. Even if those dying from COVID-19 were more likely to die than typical of their age (because the most vulnerable and those with comorbidities typically experience this as a higher risk), this would still not account for anywhere near the 34,000 ‘missing deaths’ from causes others than COVID-19. Some other explanation is needed.
The nine leading causes of death after COVID-19, January to September 2021
| Cause | Deaths | Share of all non-COVID deaths | 5-year average | Excess deaths | Excess deaths as a share of usual deaths |
|---|---|---|---|---|---|
| Dementia and Alzheimer's disease | 40,872 | 11% | 45,977 | -5,105 |
-11% |
| Heart attacks and angina | 38,683 | 10% | 40,319 | -1,636 | -4% |
| Stroke | 19,903 | 5% | 22,498 | -2,595 | -12% |
| Lung cancers | 19,508 | 5% | 20,964 | -1,456 | -7% |
| Chronic lung conditions | 16,860 | 4% | 22,609 | -5,749 | -25% |
| Symptoms, signs and ill-defined conditions | 10,951 | 3% | 8,994 | 1,957 | 22% |
| Bowel cancers | 10,529 | 3% | 10,379 | 150 | 1% |
| Influenza and pneumonia | 10,373 | 3% | 20,011 | -9,638 | -48% |
| Blood cancers | 8,111 | 2% | 8,293 | -182 | -2% |
Source: Office for National Statistics
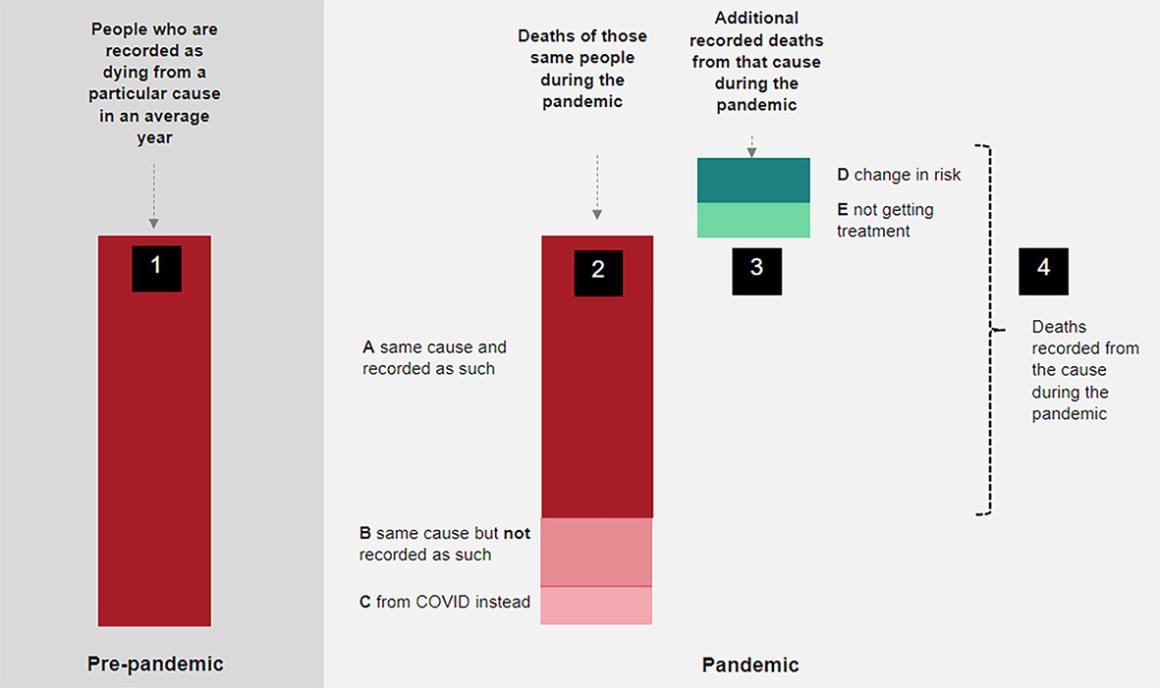
Below we explain how each of these factors might work. In practice, the same factor can act to both increase and decrease mortality, and the overall change in mortality for a given cause will be the result of interplays between these factors.
- Changes in risks as a result of differences in behaviours and environmental factors (eg accidents, pollution, alcohol consumption and infectious diseases). These can both decrease and increase mortality. Lockdowns, for example, were instituted to reduce the spread of COVID-19. But they also incidentally reduced the spread of other infectious diseases. From January 2021 to September 2021, there were 14,000 fewer deaths in England and Wales from influenza, pneumonia and chronic lung conditions. Conversely, other risks increased, such as the heavy consumption of alcohol. In 2020 there were 1,400 more deaths from cirrhosis and other diseases of the liver (up by 17%). The latter make up a large proportion of alcohol-specific deaths, which in 2020 reached the highest level for 20 years – up by 20% on the previous year.
- Changes in people’s access to and use of health or social care. The suspension of routine NHS care discouraged people from using the NHS, suspended some care entirely and has led to much longer waiting times for treatment. We discuss this at length in our long read Waiting for care, which highlighted that 58,000 fewer people than usual had had a hip replacement due to the pandemic; and there were 40,000 missed or delayed diagnoses of diabetes. Not all of these delays will have led to changes in mortality. But some will have – particularly where emergency care or cancer diagnoses (discussed further fellow) were delayed.
- Changes in how deaths are recorded. For example, during the first wave of the pandemic when testing capacity was low, particularly in care homes and the community, some COVID-19 deaths may have been recorded as deaths from dementia. This is likely to have been addressed during the second wave, when we actually see a decrease in deaths from this cause.
- Displaced mortality: people who would have died from another cause, but died earlier from COVID-19 instead. Assuming those dying from COVID-19 faced the same non-COVID mortality risk as others of their age, around 8,500 would have died between January and September 2021.
Lung cancer: an example of the complexity
There were 7% fewer lung cancer deaths between January and September 2021, compared with what we would expect. Below we use our framework to unpick this figure – and explore why and how lung cancer mortality has changed.
Our analysis suggests that the apparent reduction in lung cancer deaths is likely not a ‘true’ reduction (as the risk of developing lung cancer during the pandemic is unlikely to have changed). Instead, reductions are probably due primarily to reductions in the diagnosis of lung cancers, with some reductions due to displaced mortality (such as some lung cancer patients dying of COVID-19 before they died of lung cancer). In the longer term, we may expect an increase in lung cancer deaths. This is because those same delays in diagnosis will mean some treatable cancers will not have been diagnosed early enough.
What caused the 7% reduction in lung cancer deaths from January to June 2021 (compared with the 5-year average)?
| Change | Impact |
|---|---|
| Risks: | No effect. The risk of developing lung cancer over the short term is very unlikely to have changed. It is possible that the risk to people with lung cancer of death from co-morbidities, such as flu, may have decreased. |
| Reduced access to care: | May increase deaths in 2021. Researchers have estimated deaths from lung cancer could increase by more than 6% in the second year of the pandemic as a result of delays in diagnostic and treatment services. |
| Changes in how deaths are recorded: | Likely reduced recorded deaths in 2020. Between April 2020 and March 2021 there were 10% fewer ‘first’ treatments for lung cancer, likely the result of reductions in diagnostic services. Because lung cancer is particularly aggressive, with 60% dying within a year of diagnosis, more people will therefore have died from undiagnosed cancers. In these cases their deaths may have been recorded as from another cause. |
| Displaced mortality: | Likely reduced deaths in 2020. If those developing lung cancer were to have the same age-specific risk as the general population of dying from COVID-19, around 1% would have died from COVID-19 instead. Those with lung cancer may be heightened risk of dying from COVID-19 (if they caught it) so the true percentage may be higher. However, it is still only likely to account for a small proportion of the 7% reduction in deaths. |
Further reading
Work with us
We look for talented and passionate individuals as everyone at the Health Foundation has an important role to play.
View current vacanciesThe Q community
Q is an initiative connecting people with improvement expertise across the UK.
Find out more
