Nine major challenges facing health and care in England
Nine major challenges facing health and care in England
3 November 2023

Key points
- As we head towards the next general election, the state of the health service is one the public’s top concerns. The nation’s health is fraying, more people are living with major illness and unfair differences in health between richer and poorer areas are widening.
- Nesta’s UK 2040 Options project is looking at the defining issues facing the country ahead of the UK general election. In this long read, we highlight nine trends that represent some of the major challenges facing a new government on health and care in England – from changing health needs to the services available to meet them.
- The trends we outline paint a gloomy picture. But how they play out in future is not inevitable – and progress is possible with concerted policy action and investment. The next stage of work will set out policy options to address these challenges.
UK 2040 Options is a policy project led by Nesta that seeks to address the defining issues facing the country, from tax and economic growth to health and education. It draws on a range of experts to assess the policy landscape, explore some of the most fertile areas in more depth, test and interrogate ideas and bring fresh angles and insights to the choices that policymakers will need to confront, make and implement. options2040.co.uk
We are Nesta. The UK’s innovation agency for social good. We design, test and scale new solutions to society’s biggest problems, changing millions of lives for the better. nesta.org.uk
This report was produced in partnership with Nesta, as part of UK 2040 Options.
Figure 2
The health of the population is shaped by a combination of social and economic factors, such as income, employment, education, housing and transport.18,19 These factors combine to shape the circumstances of people’s daily lives – for instance, their access to money to pay rent for housing and the conditions in the local neighbourhood in which they live. Yet these building blocks of good health are unevenly distributed across the population – and real-terms cuts in spending on public services over the decade going into the pandemic (2009/10 to 2019/20) mean some of these building blocks are missing for too many people.20,21
The number of households in social rented homes experiencing affordability problems in the past 5 years, for example, has increased at a faster rate than in the previous two decades.22 Rates of in-work poverty in the UK have increased over the past two decades too, with almost 60% of people in poverty living in a household where someone works.23 And the total number of households in temporary accommodation in England has risen by 95% since 2011 to almost 95,000.24 More than three-fifths of these households had children. The sharp increase in the cost of living since 2021 will have brought increased stress and anxiety, and left many unable to afford the essentials needed to maintain their health.25,26 These pressures also impact on staff working in the NHS and social care.
Smoking prevalence in England has almost halved over the past three decades, from 29% in 1992 to 13% in 2022 35,36,37,38 – supported by effective population-level policies including banning smoking in public places and introducing advertising restrictions, alongside providing support for people wanting to quit.39 But inequalities persist. In 2019, 17% of adults in the most deprived areas in England smoked, compared with 9% in the least deprived.40 Among pregnant women, nearly 11% smoked at time of delivery in the most deprived areas, compared with 7% in the least deprived. Smokers working in routine and manual occupations try to quit as often as more affluent individuals, but are less likely to succeed.41
Source: Nuffield Trust
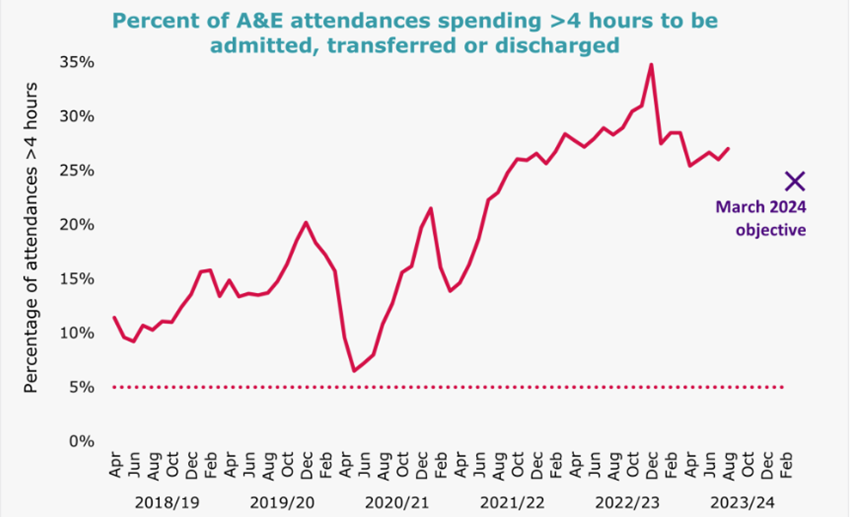
Emergency care is under intense pressure too. In 2022/23, only 70.8% of patients were admitted, discharged, or transferred within 4 hours of arrival in A&E (Figure 6) – well below the 95% target, which was last met in July 2015.49 In the same year, 410,092 people waited more than 12 hours on trolleys in emergency departments for a hospital bed – more than double the total in the preceding 10 years combined (151,120 from 2012/13 to 2021/22).50 Long delays in emergency departments are associated with increased risk of harm and deaths.51
Figure 6
Source: Nuffield Trust
Pressure on services outside hospital are harder to measure but also substantial. Large numbers of patients experiencing delayed discharges from hospital is a sign of limited capacity in social care and other community-based services to support people when they leave hospital. On an average day in July 2023, nearly 12,000 acute hospital beds – out of a total bed stock of around 100,000 in England – were occupied by patients who no longer had a medical need to be in acute care but could not be discharged home or elsewhere (though the majority of delays are likely to be attributable to the NHS, for instance due to difficulties arranging NHS rehabilitation support, rather than social care services).52 In June 2023, an estimated 992,189 people – children and adults – were waiting for community health services in England, such as community nursing and intermediate care.53
GP appointment numbers are at near-record levels, but increasing numbers of people are finding it hard to get an appointment. People still rate the overall quality of primary care highly. But the 2023 GP patient survey found half of people (50.2%) reported difficulties getting through to their practice on the phone – the highest rate ever and up sharply from 31.7% in 2019.54 27.9% said they had avoided making an appointment when they needed one in the past 12 months because they found it too difficult. Waiting times for GP and hospital care are the biggest factor behind people’s dissatisfaction with the NHS (Section 8).
State-funded social care services are under extreme strain, struggling to provide care to people who need it. The number of requests to local authorities in England for social care support rose steadily between 2015 and 2021, yet the number of people accessing publicly funded long-term care fell.55 Compared with other OECD countries, the UK has a high level of informal care provided by families and friends,56 and support for them is limited.57,58
International comparisons of health care spending also point to weak investment in the decade before the pandemic. In 2019, UK health spending as a share of GDP was similar to other EU14 countries (such as France, Germany and Sweden).61 But average day-to-day health spending in the UK between 2010 and 2019 was £3,005 per person – 18% below the EU14 average of £3,655.62 This adds up: if UK health spending per person had matched the EU14 average, it would have spent around £40bn more a year between 2010 and 2019.
The UK also spent less on health care capital – long-term investment in things like buildings, equipment, data infrastructure and IT – than comparable countries.63 If the UK had matched other EU14 countries’ average capital investment (as a share of GDP), the UK would have invested £33bn more between 2010 and 2019 (around 55% higher than actual investment) (Figure 8).64 Weak capital investment has a cumulative impact on the health system and its ability to operate effectively. Latest estimates suggest the NHS ‘maintenance backlog’ in England – the cost of bringing deteriorating buildings or equipment back into suitable working condition – reached around £10.2bn in 2021/22.65
Figure 8
Spending on public health and social care has been more constrained than the NHS. Public health interventions are in general highly cost effective.66,67 Recent research estimated that each additional year of good health (measured by quality adjusted life years) achieved by public health interventions costs around £3,800 – three to four times lower than the cost per additional year of good health from NHS interventions (£13,500).68 Yet the public health grant for local authorities in England – used to fund smoking cessation, drug and alcohol services, children's health services, and sexual health services – has been cut by 26% per person in real terms since 2015/16. Funding fell furthest in more deprived areas.69,70,71
When the pandemic hit, government spending per person on adult social care in England was lower in real terms than in 2010.72 Recent projections suggest that simply meeting growing demand for social care over the next decade would require additional spending of around £8.3bn by 2032/33.73 Doing this alongside improving access to care and providing additional funding to better meet the costs of care would come closer to £18.4bn by 2032/33.
Too hot: bed occupancy rose to around 90% in the NHS before the pandemic,75 beyond levels considered safe or efficient.76 Increased pressure on beds since COVID-19 has likely led to unexpected rationing of care, as fewer people can be admitted to hospital.77 A big driver of this has been increases in length of stay in hospital – a reversal of pre-pandemic trends.
Constrained capacity has also contributed to a more recent ‘productivity puzzle’ in the NHS, where activity in NHS hospitals has not risen in line with increases in funding and staff since 2019 (see Sections 5 and 7). More staff can only do so much without the modern buildings, equipment, IT and beds to treat patients effectively – as well as the management and analytical capacity needed to improve the way the system works. The rate of growth in hospital managers in the NHS has been slower than for clinical staff – and the NHS appears to be severely undermanaged compared with other sectors and health systems.78,79,80
As the population grows, ages and develops more complex health needs (Section 3), the capacity of the health and care system will need to expand to keep up. The number of hospital beds in England has roughly halved over the past 30 years, down to a mix of improvements in care, changes in policy and other factors. But recent projections suggest that simply maintaining 2018/19 standards of NHS care in England may require between 23,000 and 39,000 additional general and acute hospital beds by 2030/31, alongside big increases in staff (Section 7).81
Capacity also needs to grow in the right places. Despite longstanding calls to shift more NHS resources out of hospitals and into primary and community services, over the past 20 years there have been major shifts in the composition of NHS activity and spending in the opposite direction (Figure 11).82 Lack of capacity in social care and other community services is leading to unmet need and delays discharging patients (Section 4). There are also inequities in how resources are distributed. GP practices in more deprived areas of England are relatively underfunded and under-doctored compared with GP practices in richer areas.83
Figure 11
Meantime, patients and staff are feeling the strain. In the 2022 NHS staff survey, only around 26% of staff said that there were enough staff in their organisation to do their job properly.97 Nearly half (around 45%) said they felt unwell because of work-related stress over the previous 12 months and around a third (34%) reported burnout. Staff gaps are one of the main reasons for falling public satisfaction with the NHS (Section 8), and boosting staff numbers and reducing staff workload are among the public’s top priorities for the NHS.98
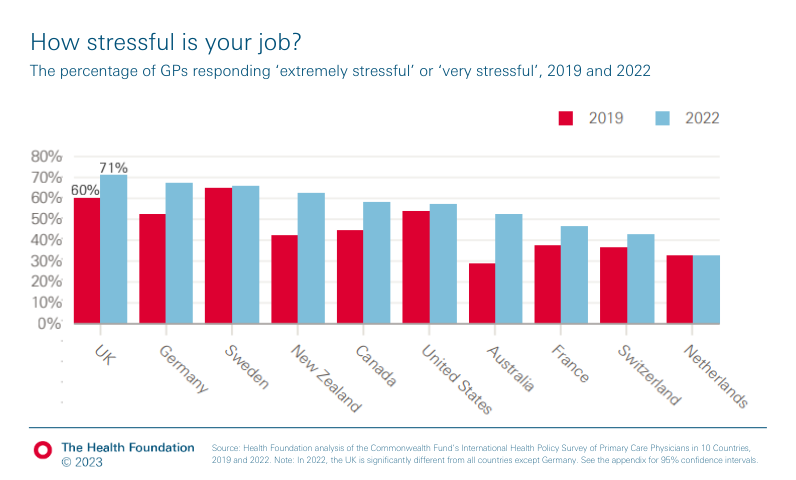
The experience of GPs in the UK compared with other countries is stark. A recent survey compared the working lives of GPs in 10 high-income countries including the UK, US, France, Germany and Australia. GPs in all countries were dealing with higher workloads than before the pandemic – and many have experienced greater stress and emotional distress.99 But UK GPs reported higher levels of emotional distress and bigger rises in workload than GPs in other countries (Figure 13). Many are considering leaving the profession altogether.100 UK GPs also reported among the highest levels of stress and lowest job satisfaction. Just a decade earlier, UK GPs were among the most satisfied of any country.
Figure 13
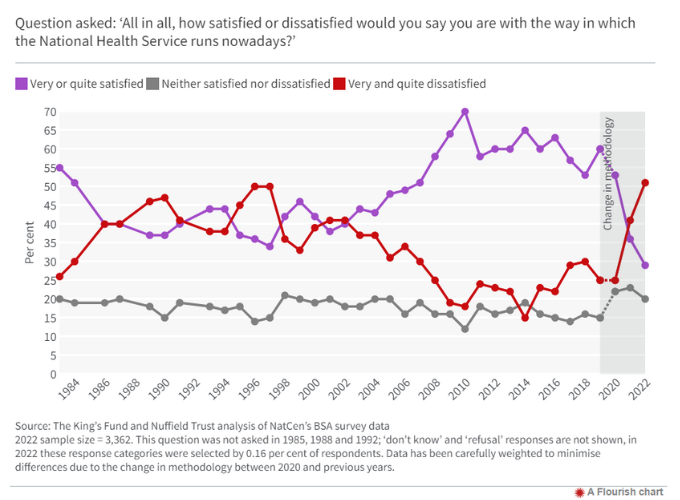
The public is pessimistic about how NHS services will fare in future. Recent polling found that 54% of people expect standards of NHS care to get worse in the coming year and only 11% expects standards to improve.102 There is also concern about the NHS’s ability to meet future challenges. 77% of the public thinks the service is not prepared to meet the increasing health demands of an ageing population (just 17% said it was prepared).103
Despite falling satisfaction with NHS services, the UK public continues to overwhelmingly support the core principles of the NHS. 90% of people think the NHS should be free at the point of delivery, 89% that the NHS should provide a comprehensive service available to everyone and 84% that the NHS should be primarily funded through taxation (Figure 15).104 These principles receive majority support across the party-political spectrum. 72% of people see the NHS as ‘crucial to British society’ and think that ‘we must do everything to maintain it’.105 This includes strong support among the public for increasing NHS funding (Section 5).
Figure 15
Despite this, the public has real concerns about whether the NHS model will be maintained in the years ahead. When asked if the NHS would be generally free at the point of use in 10 years’ time, half of respondents (51%) said they expect to pay for some services that are currently free at the point of use and 13% expected to pay for ‘most’ services.106
- Nuffield Trust. NHS performance tracker. Nuffield Trust; 2023 (www.nuffieldtrust.org.uk/qualitywatch/nhs-performance-summary).
- Morris J et al. Public satisfaction with the NHS and social care in 2022: Results from the British Social Attitudes Survey. The King’s Fund; 2023 (www.kingsfund.org.uk/publications/public-satisfaction-nhs-and-social-care-2022).
- Raleigh V. What is happening to life expectancy in England?. The King’s Fund. (www.kingsfund.org.uk/publications/whats-happening-life-expectancy-england).
- Watt T, Raymond A, Rachet-Jacquet L. Quantifying health inequalities in England. The Health Foundation; 2022 (www.health.org.uk/news-and-comment/charts-and-infographics/quantifying-health-inequalities).
- Office for National Statistics. Rising ill-health and economic inactivity because of long-term sickness, UK: 2019 to 2023. Office for National Statistics; 2023.
- Nesta. UK 2040 Options [webpage]. Nesta; 2023 (https://options2040.co.uk/).
- Delestre I, Miller H. Tax and public finances: the fundamentals. Institute for Fiscal; 2023 (https://ifs.org.uk/publications/tax-and-public-finances-fundamentals).
- Marshall L et al. Mortality and life expectancy trends in the UK: Stalling progress. The Health Foundation; 2019 (www.health.org.uk/publications/reports/mortality-and-life-expectancy-trends-in-the-uk).
- Marmot M et al. Health Equity in England: The Marmot Review 10 Years On. Institute of Health Equity and The Health Foundation; 2020 (www.health.org.uk/publications/reports/the-marmot-review-10-years-on).
- The Health Foundation. International life expectancy at birth by sex. The Health Foundation; 2022 (www.health.org.uk/evidence-hub/health-inequalities/international-life-expectancy-at-birth-by-sex).
- Tinson A. Healthy life expectancy target: the scale of the challenge: Does the government’s health mission measure up?. The Health Foundation; 2022 (www.health.org.uk/news-and-comment/charts-and-infographics/healthy-life-expectancy-target-the-scale-of-the-challenge).
- Marmot M et al. Fair Society, Healthy Live (The Marmot Review). Institute of Health Equity; 2010 (www.instituteofhealthequity.org/resources-reports/fair-society-healthy-lives-the-marmot-review).
- Marmot M et al. Health Equity in England: The Marmot Review 10 Years On. Institute of Health Equity and The Health Foundation; 2020 (www.health.org.uk/publications/reports/the-marmot-review-10-years-on).
- The Health Foundation. Life expectancy and healthy life expectancy at birth by deprivation. The Health Foundation; 2022 (www.health.org.uk/evidence-hub/health-inequalities/life-expectancy-and-healthy-life-expectancy-at-birth-by-deprivation).
- Marmot M et al. Health Equity in England: The Marmot Review 10 Years On. Institute of Health Equity and The Health Foundation; 2020 (www.health.org.uk/publications/reports/the-marmot-review-10-years-on).
- Raleigh V. What is happening to life expectancy in England?. The King’s Fund. (www.kingsfund.org.uk/publications/whats-happening-life-expectancy-england).
- Suleman M et al. Unequal pandemic, fairer recovery: The COVID-19 impact inquiry report. The Health Foundation; 2021 (www.health.org.uk/publications/reports/unequal-pandemic-fairer-recovery).
- Bibby J, Lovell N. What makes us healthy? An introduction to the social determinants of health. The Health Foundation; 2018 (www.health.org.uk/publications/what-makes-us-healthy).
- McGovern L. The Relative Contribution of Multiple Determinants to Health. Health Affairs; 2014 (www.healthaffairs.org/do/10.1377/hpb20140821.404487/).
- Marmot M et al. Health Equity in England: The Marmot Review 10 Years On. Institute of Health Equity and The Health Foundation; 2020 (www.health.org.uk/publications/reports/the-marmot-review-10-years-on).
- Zaranko B. Spending Review 2020: COVID-19, Brexit and beyond. Institute for Fiscal Studies; 2020 (https://ifs.org.uk/books/spending-review-2020-covid-19-brexit-and-beyond).
- The Health Foundation. Housing affordability trends by tenure. The Health Foundation; 2023 (www.health.org.uk/evidence-hub/housing/housing-affordability/trends-in-housing-affordability-by-tenure).
- The Health Foundation. In-work poverty trends. The Health Foundation; 2022 (www.health.org.uk/evidence-hub/money-and-resources/poverty/in-work-poverty-trends).
- The Health Foundation. Trends in people needing emergency temporary accommodation. The Health Foundation; 2023 (www.health.org.uk/evidence-hub/housing/housing-stability-and-security/trends-in-emergency-temporary-accommodation).
- Finch D. The cost-of-living crisis is a health emergency too. The Health Foundation; 2022 (www.health.org.uk/news-and-comment/blogs/the-cost-of-living-crisis-is-a-health-emergency-too).
- Francis-Devine B et al. Research Briefing: Rising cost of living in the UK. House of Commons Library; 2023 (https://commonslibrary.parliament.uk/research-briefings/cbp-9428/).
- Everest G et al. Addressing the leading risk factors for ill health: A review of government policies tackling smoking, poor diet, physical inactivity and harmful alcohol use in England. The Health Foundation; 2022 (www.health.org.uk/publications/reports/addressing-the-leading-risk-factors-for-ill-health).
- Marteau T et al. ‘Changing behaviour: an essential component of tackling health inequalities.’ BMJ; 2021. 372(332) (www.ncbi.nlm.nih.gov/pmc/articles/PMC7879795/).
- Marmot M et al. Health Equity in England: The Marmot Review 10 Years On. Institute of Health Equity and The Health Foundation; 2020 (www.health.org.uk/publications/reports/the-marmot-review-10-years-on).
- Lee K, Freudenberg N. ‘Public Health Roles in Addressing Commercial Determinants of Health’. Annual Review of Public Health. 2022. 43: 375-295 (www.annualreviews.org/doi/10.1146/annurev-publhealth-052220-020447).
- Bell M, Deyes K. The annual social cost of obesity in the UK. Frontier Economics; 2022 (www.frontier-economics.com/uk/en/news-and-articles/articles/article-i9130-the-annual-social-cost-of-obesity-in-the-uk/).
- Everest G et al. Addressing the leading risk factors for ill health: A review of government policies tackling smoking, poor diet, physical inactivity and harmful alcohol use in England. The Health Foundation; 2022 (www.health.org.uk/publications/reports/addressing-the-leading-risk-factors-for-ill-health).
- Everest G et al. Addressing the leading risk factors for ill health: A review of government policies tackling smoking, poor diet, physical inactivity and harmful alcohol use in England. The Health Foundation; 2022 (www.health.org.uk/publications/reports/addressing-the-leading-risk-factors-for-ill-health).
- NHS Digital. National child measurement programme, England, 2021/22 school year; 2022 (https://digital.nhs.uk/data-and-information/publications/statistical/national-child-measurement-programme/2021-22-school-year/deprivation).
- Health and Social Care Information Centre. Smoking [webpage]; 2019 (http://healthsurvey.hscic.gov.uk/data-visualisation/data-visualisation/explore-the-trends/smoking.aspx).
- Finch D, Briggs A, Tallack C. Improving health by tackling market failure. The Health Foundation; 2020 (www.health.org.uk/publications/long-reads/improving-health-by-tackling-market-failure).
- Office for National Statistics. Adult smoking habits in the UK: 2021. Office for National Statistics; 2022.
- Office for National Statistics. Adult smoking habits in the UK: 2022. Office for National Statistics; 2023.
- Everest G et al. Addressing the leading risk factors for ill health: A review of government policies tackling smoking, poor diet, physical inactivity and harmful alcohol use in England. The Health Foundation; 2022 (www.health.org.uk/publications/reports/addressing-the-leading-risk-factors-for-ill-health).
- Office for Health Improvement & Disparities. Fingertips - Local tobacco control profiles; 2022 (https://fingertips.phe.org.uk/profile/tobacco-control/data).
- Action on Smoking and Health. Health inequalities and smoking. Action on Smoking and Health; 2019 (https://ash.org.uk/resources/view/health-inequalities-and-smoking).
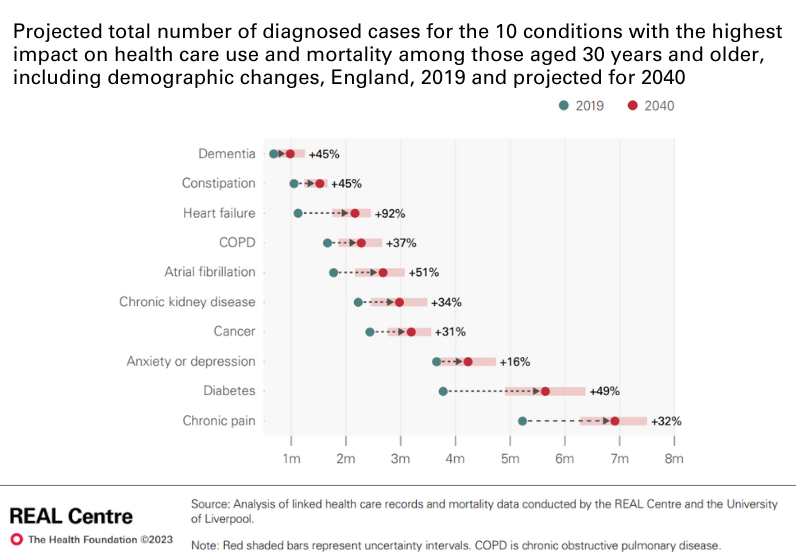
- Watt T et al. Health in 2040: projected patterns of illness in England. The Health Foundation; 2023 (www.health.org.uk/publications/health-in-2040).
- Head A et al. Inequalities in incident and prevalent multimorbidity in England, 2004-2019: a population-based, descriptive study. The Lancet Health Longevity. 2021; 2: e489-497 (www.thelancet.com/journals/lanhl/article/PIIS2666-7568(21)00146-X/fulltext#seccestitle10).
- Stafford M et al. Understanding the health care needs of people with multiple health conditions. The Health Foundation; 2018 (www.health.org.uk/publications/understanding-the-health-care-needs-of-people-with-multiple-health-conditions).
- Watt T, Raymond A, Rachet-Jacquet L. Quantifying health inequalities in England. The Health Foundation; 2022 (www.health.org.uk/news-and-comment/charts-and-infographics/quantifying-health-inequalities).
- Nuffield Trust. NHS performance tracker. Nuffield Trust; 2023 (www.nuffieldtrust.org.uk/qualitywatch/nhs-performance-summary).
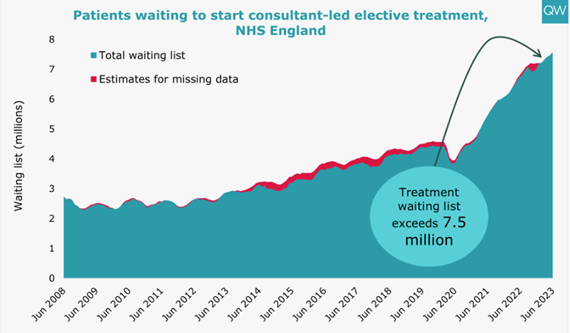
- NHS England. Referral to Treatment (RTT) Waiting Times – 2023/24 RTT waiting times data. 2023 (www.england.nhs.uk/statistics/statistical-work-areas/rtt-waiting-times/).
- Nuffield Trust. NHS performance tracker. Nuffield Trust; 2023 (www.nuffieldtrust.org.uk/qualitywatch/nhs-performance-summary).
- Nuffield Trust. NHS performance tracker. Nuffield Trust; 2023 (www.nuffieldtrust.org.uk/qualitywatch/nhs-performance-summary).
- Nuffield Trust. NHS performance tracker. Nuffield Trust; 2023 (www.nuffieldtrust.org.uk/qualitywatch/nhs-performance-summary).
- Jones S et al. Association between delays to patient admission from the emergency department and all-cause 30-mortality. Emergency Medicine Journal. 2022; 39(3): 168-173 (https://pubmed.ncbi.nlm.nih.gov/35042695/).
- NHS England. Discharge delays (acute) – monthly timeseries. 2023 (www.england.nhs.uk/statistics/statistical-work-areas/discharge-delays-acute-data/).
- NHS England. Community Health Services Waiting List – monthly publication. 2023 (www.england.nhs.uk/statistics/statistical-work-areas/community-health-services-waiting-lists/).
- Ipsos. GP Patient Survey: National report, 2023 survey. GP Patient Survey; 2023 (https://gp-patient.co.uk/surveysandreports).
- Bottery S, Mallorie S. Social care 360. The King’s Fund; 2023 (www.kingsfund.org.uk/publications/social-care-360).
- OECD. Health at a Glance 2019 – informal carers [webpage]. OECD; 2019 (www.oecd-ilibrary.org/sites/a80d9f62-en/index.html?itemId=/content/component/a80d9f62-en).
- Peytrignet S, Grimm F, Tallack C. Understanding unpaid carers and their access to support. The Health Foundation; 2023 (www.health.org.uk/publications/long-reads/understanding-unpaid-carers-and-their-access-to-support).
- Idriss O, Allen L, Alderwick H. Social care for adults aged 18-64. The Health Foundation; 2020 (www.health.org.uk/publications/reports/social-care-for-adults-aged-18-64).
- Boccarini G. Health care funding: Three key questions about funding in England. The Health Foundation; 2023 (www.health.org.uk/publications/long-reads/health-care-funding).
- Allen L et al. Public perceptions of health and social care: what are the priorities ahead of a general election?. The Health Foundation; 2023 (www.health.org.uk/publications/long-reads/public-perceptions-health-and-social-care-priorities-general-election).
- OECD. OECD Data – Health spending (indicator); 2023 (https://data.oecd.org/healthres/health-spending.htm).
- Rebolledo I, Charlesworth A. How does UK health spending compare across Europe over the past decade?. The Health Foundation; 2022 (www.health.org.uk/news-and-comment/charts-and-infographics/how-does-uk-health-spending-compare-across-europe-over-the-past-decade).
- Kraindler J, Gershlick B, Charlesworth A. Failing to capitalise: Capital spending in the NHS. The Health Foundation; 2019 (www.health.org.uk/publications/reports/failing-to-capitalise).
- Rebolledo I, Charlesworth A. How does UK health spending compare across Europe over the past decade?. The Health Foundation; 2022 (www.health.org.uk/news-and-comment/charts-and-infographics/how-does-uk-health-spending-compare-across-europe-over-the-past-decade).
- Boccarini G. Health care funding: Three key questions about funding in England. The Health Foundation; 2023 (www.health.org.uk/publications/long-reads/health-care-funding).
- Martin S, Lomas J, Claxton K. Is an ounce of prevention worth a pound of cure? A cross sectional study of the impact of English public health grant on mortality and morbidity. Centre for Health Economics, University of York; 2019 (https://pure.york.ac.uk/portal/en/publications/is-an-ounce-of-prevention-worth-a-pound-of-cure-a-cross-sectional).
- Ford J et al. Making the case for prevention. Primary Care Unit, University of Cambridge; 2021 (www.phpc.cam.ac.uk/pcu/research/research-groups/crmh/research/crmh-health-inequalities/making-the-case-for-prevention/).
- Martin S, Lomas J, Claxton K. Is an ounce of prevention worth a pound of cure? A cross sectional study of the impact of English public health grant on mortality and morbidity. Centre for Health Economics, University of York; 2019 (https://pure.york.ac.uk/portal/en/publications/is-an-ounce-of-prevention-worth-a-pound-of-cure-a-cross-sectional).
- Finch D, Vriend M. Public health grant: what it is and why greater investment is needed. The Health Foundation; 2023 (www.health.org.uk/news-and-comment/charts-and-infographics/public-health-grant-what-it-is-and-why-greater-investment-is-needed)
- Alexiou et al. ‘Local government funding and life expectancy in England: a longitudinal ecological study.’ Lancet Public Health. 2021; 6(9): e641-e647 (www.ncbi.nlm.nih.gov/pmc/articles/PMC8390384/).
- Gray M, Barford A. ‘The depths of the cuts: the uneven geography of local government austerity.’ Cambridge Journal of Regions, Economy and Society. 2018; 11(3): 541-563 (https://ideas.repec.org/a/oup/cjrecs/v11y2018i3p541-563..html).
- Health Foundation. Health Foundation’s response to the Health and Social Care Select Committee inquiry on social care: funding and workforce. 2020 (www.health.org.uk/news-and-comment/consultation-responses/social-care-funding-and-workforce-inquiry-response).
- Boccarini G et al. Adult social care funding pressures: Estimated costs to meet growing demand and improve services in England. The Health Foundation; 2023 (www.health.org.uk/publications/long-reads/adult-social-care-funding-pressures).
- Anandaciva S. How does the NHS compare to the health care systems of other countries? The King’s Fund; 2023 (www.kingsfund.org.uk/publications/nhs-compare-health-care-systems-other-countries).
- Rocks S, Rachet-Jacquet L. How many hospital beds will the NHS need over the coming decade? Projections: general and acute hospital beds in England (2018-2030). The Health Foundation; 2022 (www.health.org.uk/publications/reports/how-many-beds-will-the-nhs-need-over-the-coming-decade).
- National Institute for Health and Care Excellence. Chapter 39: Bed occupancy – emergency and acute medical care in over 16s – service delivery and organisation (NICE guideline 94). 2018 (www.ncbi.nlm.nih.gov/books/NBK564920/).
- Cavallaro F et al. Longer hospital stays and fewer admissions: how NHS hospital care changed in England between 2019 and 2022. The Health Foundation; 2023 (www.health.org.uk/publications/long-reads/longer-hospital-stays-and-fewer-admissions).
- Jones B, Horton T, Home J. Strengthening NHS management and leadership: Priorities for reform. The Health Foundation; 2022 (www.health.org.uk/publications/long-reads/strengthening-nhs-management-and-leadership).
- Freedman S, Wolf R. The NHS productivity puzzle: why has hospital activity not increased in line with funding and staffing? Institute for Government; 2023 (www.instituteforgovernment.org.uk/publication/nhs-productivity).
- Warner M, Zaranko B. NHS funding, resources and treatment volumes. Institute for Fiscal Studies; 2022 (https://ifs.org.uk/publications/nhs-funding-resources-and-treatment-volumes).
- Rocks S, Rachet-Jaquet L. How many hospital beds will the NHS need over the coming decade? Projections: general and acute hospital beds in England (2018-2030). The Health Foundation; 2022 (www.health.org.uk/publications/reports/how-many-beds-will-the-nhs-need-over-the-coming-decade).
- Tallack C et al. The bigger picture: Learning from two decades of changing NHS care in England. The Health Foundation; 2020 (www.health.org.uk/publications/reports/the-bigger-picture).
- Fisher et al. Tackling the inverse care law: Analysis of policies to improve general practice in deprived areas since 1990. The Health Foundation; 2022 (www.health.org.uk/publications/reports/tackling-the-inverse-care-law).
- OECD. Health Statistics 2023. 2023 (www.oecd.org/els/health-systems/health-data.htm).
- Anandaciva S. How does the NHS compare to the health care systems of other countries? The King’s Fund; 2023 (www.kingsfund.org.uk/publications/nhs-compare-health-care-systems-other-countries).
- Freedman S, Wolf R. The NHS productivity puzzle: why has hospital activity not increased in line with funding and staffing? Institute for Government; 2023 (www.instituteforgovernment.org.uk/publication/nhs-productivity).
- NHS Digital. NHS Vacancy Statistics England, April 2015-June 2023, Experimental Statistics. 2023 (https://digital.nhs.uk/data-and-information/publications/statistical/nhs-vacancies-survey/april-2015---june-2023-experimental-statistics).
- Shembavnekar N et al. Projections: General practice workforce in England. The Health Foundation; 2022 (www.health.org.uk/publications/reports/projections-general-practice-workforce-in-england).
- Fraser C, Beech J. General practice tracker: Monitoring data on GP appointments and workforce. The Health Foundation; n.d. (www.health.org.uk/news-and-comment/charts-and-infographics/general-practice-tracker).
- Skills for Care. The size and structure of the adult social care sector and workforce in England. 2023 (www.skillsforcare.org.uk/Adult-Social-Care-Workforce-Data/Workforce-intelligence/publications/national-information/The-size-and-structure-of-the-adult-social-care-sector-and-workforce-in-England.aspx).
- Griffiths P et al. Nurse staffing and patient outcomes: strengths and limitations of the evidence to inform policy and practice. A review and discussion paper based on evidence reviewed for the National Institute for Health and Care Excellence Safe Staffing guideline development. International Journal of Nursing Studies. 2016; 63:213-25 (https://pubmed.ncbi.nlm.nih.gov/27130150/).
- Care Quality Commission. The state of health and social care in England 2020/21. 2021 (www.cqc.org.uk/publications/major-report/state-care).
- Warner M, Zaranko B. Implications of the NHS workforce plan: Green Budget 2023 (Chapter 8). Institute for Fiscal Studies; 2023 (https://ifs.org.uk/publications/implications-nhs-workforce-plan).
- Shembavnekar N, Kelly E, Charlesworth A. How feasible are the NHS Long Term Workforce Plan commitments on training? The Health Foundation; 2023 (www.health.org.uk/publications/long-reads/how-feasible-are-the-nhs-long-term-workforce-plan-commitments-on-training).
- Allen L et al. The cost of caring: poverty and deprivation among residential care workers in the UK. The Health Foundation; 2022 (www.health.org.uk/publications/long-reads/the-cost-of-caring).
- Migration Advisory Committee. Adult Social Care and Immigration: A Report from the Migration Advisory Committee. Migration Advisory Committee; 2022 (www.gov.uk/government/publications/review-of-adult-social-care-2022).
- NHS Staff Survey. NHS Staff Survey 2022: National results briefing. Survey Coordination Centre; 2023 (www.nhsstaffsurveys.com/results/national-results/).
- Buzelli L. Public perceptions of the NHS: a winter of discontent. The Health Foundation; 2023 (www.health.org.uk/publications/long-reads/public-perceptions-of-the-nhs-a-winter-of-discontent).
- Beech J et al. Stressed and overworked: What the Commonwealth Fund’s 2022 International Health Policy Survey of Primary Care Physicians in 10 Countries means for the UK. The Health Foundation; 2023 (www.health.org.uk/publications/reports/stressed-and-overworked).
- Odebiyi B et al. Eleventh National GP Worklife Survey 2021. Policy Research Unit in Commissioning and the Healthcare System (PRUComm); 2022 (https://prucomm.ac.uk/eleventh-national-gp-worklife-survey-2021.html).
- Morris J et al. Public satisfaction with the NHS and social care in 2022: Results from the British Social Attitudes Survey. The King’s Fund; 2023 (www.kingsfund.org.uk/publications/public-satisfaction-nhs-and-social-care-2022).
- Allen L et al. Public perceptions of health and social care: what are the priorities ahead of a general election?. The Health Foundation; 2023 (www.health.org.uk/publications/long-reads/public-perceptions-health-and-social-care-priorities-general-election).
- Buzelli L et al. How the public views the NHS at 75. The Health Foundation; 2023 (www.health.org.uk/news-and-comment/charts-and-infographics/how-the-public-views-the-nhs-at-75).
- Buzelli L. Public perceptions of the NHS: a winter of discontent. The Health Foundation; 2023 (www.health.org.uk/publications/long-reads/public-perceptions-of-the-nhs-a-winter-of-discontent).
- Buzelli L et al. How the public views the NHS at 75. The Health Foundation; 2023 (www.health.org.uk/news-and-comment/charts-and-infographics/how-the-public-views-the-nhs-at-75).
- Buzelli L et al. How the public views the NHS at 75. The Health Foundation; 2023 (www.health.org.uk/news-and-comment/charts-and-infographics/how-the-public-views-the-nhs-at-75).
- Alderwick H et al. ‘Will a new NHS structure in England help recovery from the pandemic?’ BMJ. 2021; 372: n248 (www.bmj.com/content/372/bmj.n248).
- Dunn P et al. Integrated care systems: what do they look like? The Health Foundation; 2022 (www.health.org.uk/publications/long-reads/integrated-care-systems-what-do-they-look-like).
- Alderwick H et al. ‘Will a new NHS structure in England help recovery from the pandemic?’ BMJ. 2021; 372: n248 (www.bmj.com/content/372/bmj.n248).
- Charlesworth A, Tallack C, Alderwick H. If not now, when? The long overdue promise of social care reform. The Health Foundation; 2021 (www.health.org.uk/news-and-comment/blogs/if-not-now-when-the-long-overdue-promise-of-social-care-reform).
- Alderwick H, Tallack C, Watt T. What should be done to fix the crisis in social care? Five priorities for government. The Health Foundation; 2019 (www.health.org.uk/publications/long-reads/what-should-be-done-to-fix-the-crisis-in-social-care).
- Davies N et al. Performance Tracker 2022/23 – Spring update. Institute for Government; 2023 (www.instituteforgovernment.org.uk/performance-tracker-2022-23).
- Delestre I, Miller H. Tax and public finances: the fundamentals. Institute for Fiscal; 2023 (https://ifs.org.uk/publications/tax-and-public-finances-fundamentals).
- Dixon J, Alderwick H. ‘The NHS at 75’. BMJ.2023; 318: 1458 (www.bmj.com/content/381/bmj.p1458).
- Delestre I, Miller H. Tax and public finances: the fundamentals. Institute for Fiscal; 2023 (https://ifs.org.uk/publications/tax-and-public-finances-fundamentals).
- Lewis R et al. ‘Integrated Care in England – what can we learn from a decade of National Pilot Programmes? International Journal of Integrated Care. 2021; 21(4): 5 (www.ncbi.nlm.nih.gov/pmc/articles/PMC8555475/).
- Tallack C et al. The bigger picture: Learning from two decades of changing NHS care in England. The Health Foundation; 2020 (www.health.org.uk/publications/reports/the-bigger-picture).
- Alderwick H, Tallack C, Watt T. What should be done to fix the crisis in social care? Five priorities for government. The Health Foundation. 2019 (www.health.org.uk/publications/long-reads/what-should-be-done-to-fix-the-crisis-in-social-care).
- Adams J et al. ‘Why are some population interventions for diet and obesity more equitable and effective than others? The role of individual agency.’ PLOS Medicine. 2016; 13(4): e1001990 (https://journals.plos.org/plosmedicine/article?id=10.1371/journal.pmed.1001990).
- Marteau T et al. ‘Increasing healthy life expectancy equitably in England by 5 years by 2035: could it be achieved?’ The Lancet. 2019; 393(10191): 2571-2573 (www.thelancet.com/action/showPdf?pii=S0140-6736%2819%2931510-7).
- Lorenc T et al. ‘What types of interventions generate inequalities? Evidence from systematic reviews.’ Journal of Epidemiology & Community Health. 2013; 67: 190-193 (https://jech.bmj.com/content/67/2/190.long).
- Everest G et al. Addressing the leading risk factors for ill health: A review of government policies tackling smoking, poor diet, physical inactivity and harmful alcohol use in England. The Health Foundation; 2022 (www.health.org.uk/publications/reports/addressing-the-leading-risk-factors-for-ill-health).
- Alderwick H et al. ‘Will a new NHS structure in England help recovery from the pandemic?’ BMJ. 2021; 372: n248 (www.bmj.com/content/372/bmj.n248).
- Alderwick H. ‘Rhetoric about NHS reform is misplaced.’ BMJ.2023; 380: p54 (www.bmj.com/content/380/bmj.p54).
- Thorlby R. Social health insurance: be careful what you wish for. The Health Foundation; 2023 (www.health.org.uk/news-and-comment/blogs/social-health-insurance-be-careful-what-you-wish-for).
- Dixon J, Alderwick H. ‘The NHS at 75’. BMJ.2023; 318: 1458 (www.bmj.com/content/381/bmj.p1458).
- Appleby J, Harrison A. The war on waiting for hospital treatment: what has Labour achieved and what challenges remain? The King’s Fund; 2005 (www.kingsfund.org.uk/publications/war-waiting-hospital-treatment).
- Murray R. Lessons from the 2000s: the ambition to reduce waits must be matched with patience and realism. The King’s Fund; 2021 (www.kingsfund.org.uk/publications/nhs-waiting-times).
- Finch D, Briggs A, Tallack C. Improving health by tackling market failure. The Health Foundation; 2020 (www.health.org.uk/publications/long-reads/improving-health-by-tackling-market-failure).
- Holdroyd I et al. Systematic review of the effectiveness of the health inequalities strategy in England between 1999 and 2010. BMJ Open. 2022; 12: e063137 (https://bmjopen.bmj.com/content/12/9/e063137.long).
- Vodden A et al. Evaluation of the national governmental efforts between 1997 and 2010 in reducing health inequalities in England. Public Health. 2023; 218: 128-35 (https://europepmc.org/article/med/37019028).
Further reading
Work with us
We look for talented and passionate individuals as everyone at the Health Foundation has an important role to play.
View current vacanciesThe Q community
Q is an initiative connecting people with improvement expertise across the UK.
Find out more
