Weekly deaths are significantly higher than in the same period over the past five years COVID-19 chart series
23 April 2020

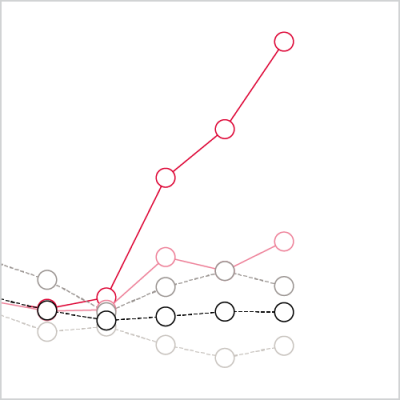
- This chart compares the total number of deaths registered each week to the average, minimum and maximum number of deaths reported in the previous 5 years (2015-2019). The number of deaths in the most recent week exceeds the average for the same week in the previous 5 years by 7,998.
- For the last three weeks even with COVID-19 deaths excluded they have been at or higher than the maximum of the previous five years.
- This increase in non-COVID-19 related deaths suggests either underdiagnosis of the role of the virus in the cause of some deaths, or indirectly caused deaths. For instance, due to people not seeking treatment, disruption to usual medical care, or other causes related to the pandemic and social distancing measures.
- Please note that we are no longer updating this chart. It was last updated in May 2020.
Each week the Office for National Statistics (ONS) releases information on the number of deaths in England and Wales. These are deaths that occur in hospitals or the community from any cause (including, but not limited to, those attributed to COVID-19). Since the 7 April 2020 release, the ONS has also published a separate count of the number of deaths where COVID-19 has been mentioned on the death certificate.
How many deaths related to COVID-19 have been registered?
The latest data published on 21 April shows a total 6,213 deaths registered in the week ending 10 April 2020 in England and Wales where COVID-19 is mentioned on the death certificate. This is up from 3,475 registered in the previous week.
How does the number of deaths in the latest week compare to previous years?
The chart compares the total number of deaths registered each week to the average, minimum and maximum number of deaths reported in the previous 5 years (2015-2019). The number of deaths in the most recent week exceeds the average for the same week in the previous 5 years by 7,998.
High weekly death numbers are usually caused by flu outbreaks or cold weather in winter. In recent years those highs have been significantly below the scale of the latest week. In spring, we usually see fewer deaths as the weather warms and the flu season ends.
Are all of the excess deaths observed directly related to COVID-19?
In the same chart we also plot the number of deaths where COVID-19 is not mentioned on the death certificate. Weekly deaths in 2020 had been close to the minimum weekly count for the previous five years, potentially reflecting a continuation of improvements in mortality observed in 2019. For the last three weeks even with COVID-19 deaths excluded they have been at or higher than the maximum of the previous five years.
What could be causing the increase in deaths if not COVID-19?
The increase in non-COVID-19 related deaths suggests either underdiagnosis of the role of the virus in the cause of some deaths, or indirectly caused deaths. For instance, due to people not seeking treatment, disruption to usual medical care, or other causes related to the pandemic and social distancing measures.
Monthly data released by ONS for March 2020 showed a fall in deaths from historic leading causes of death – such as dementia and Alzheimer’s disease and Ischaemic heart diseases – compared to March in previous years. However, COVID-19 related deaths only began to be registered in March and it is difficult to draw firm conclusions from the data.
Could COVID-19 be misreported as a similar disease?
The weekly release provides information about deaths where respiratory disease is the underlying cause. Those deaths were only 241 higher in the week ending 10 April than the average of 1,569 for the same week over the previous five years, accounting for only a fraction (14%) of the non-COVID 19 related excess (1,783).
Further reading
Work with us
We look for talented and passionate individuals as everyone at the Health Foundation has an important role to play.
View current vacanciesThe Q community
Q is an initiative connecting people with improvement expertise across the UK.
Find out more

