Deaths and serious injuries by road user type
31 October 2023
- In 2021, 42 people travelling by car were killed or seriously injured per billion miles travelled, compared with 956 cyclists and 2,040 motorcyclists. In addition, 76 pedestrians per million people were killed or seriously injured.
Road accidents are a major source of preventable death, serious injury and psychological trauma. Personal safety concerns can also force people to avoid certain areas that are perceived as dangerous, or can prevent them from using certain modes of transport altogether.
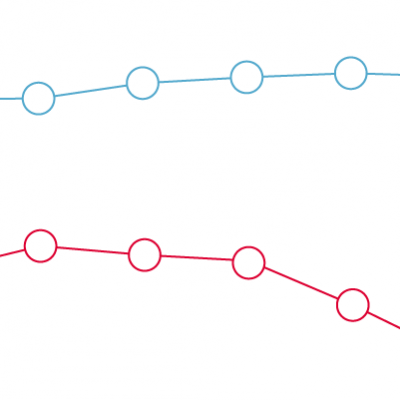
This chart shows road casualty rates of people who have been killed or seriously injured, as a share of billion miles travelled for users of different modes of transport in Great Britain and pedestrians per million people between 1979 and 2021. These rates reflect the relative risk of being killed or seriously injured. The largest absolute number of casualties is from car occupants, due to the greater distance travelled by car.
In 2021, 42 people per billion miles were killed or seriously injured when travelling by car. The rate for motorcyclists was almost 50 times higher (2,040 per billion miles) than for cars, and over 20 times higher for cyclists (956 per billion miles).
Compared with 1979, the risk of death or serious injury per mile travelled has declined for all user types. This partly reflects successful legislation promoting better safety standards, such as compulsory seat belts, speed limits, better vehicle technology and highway engineering.
In the past decade, this downward trend has reversed for both motorcyclists (the death or serious injury rate per billion miles increased from 1,812 to 2,040 between 2010 and 2021) and cyclists (increasing from 895 to 956 over the same period).
In 2021, 76 pedestrians per million people were killed or seriously injured. Pedestrian deaths have been on a downward trend since 1980 - the rate of serious accidents fell by almost 80% in that time-frame.
Past trends suggest that previous policy interventions have been successful in reducing preventable casualties, although the risk of death or serious injury remains relatively high for more vulnerable groups of road users, such as motorcyclists, cyclists and pedestrians. Safety interventions should aim to remove health hazards for all road users, instead of focusing only on the group that currently generates the largest absolute number of incidents.
- The figures include accidents reported to the police using the STATS19 reporting system. In some circumstances, there is no obligation to report road accidents to the police, which means that the figures are likely to be underestimated. Estimates based on hospital admissions tend to be higher than the figures reported here.
- Changes in severity reporting systems since 2016 mean that the latest data is not directly comparable to earlier figures.
Source: Health Foundation analysis of Department for Transport; Reported road collisions, vehicles and casualties tables for Great Britain, 1979 to 2021.