Health benefits of active travel: preventable early deaths
19 April 2021
Key points
- If walking and cycling rates in all regions in England increase to the same level as the regions with the highest average daily miles walked and cycled per person, around 1,190 early deaths could be prevented each year.
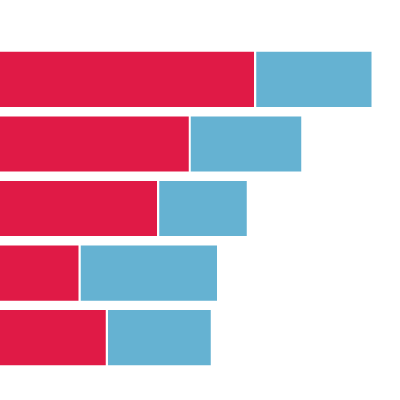
This chart shows the estimated number of preventable early deaths due to increased physical activity, if walking and cycling rates in all regions met the highest existing rates, for different age groups in each region of England. The estimates are derived from the World Health Organization’s health economic assessment tool (HEAT), which calculates the reduction in mortality as a result of physical activity from regular walking and cycling.
Increasing physical activity and minimising the time spent sitting down helps to maintain a healthy weight and reduces the risk of cardiovascular disease, type 2 diabetes, cancer and depression. The UK Chief Medical Officers recommend that adults should do at least 150 minutes of moderate activity, or 75 minutes of vigorous activity, each week.
The number of preventable early deaths is the difference between the current level of walking and cycling and a hypothetical scenario in which walking and cycling rates for different age groups in all regions increase to the same level as the regions where each age group has the highest average daily miles walked and cycled per person.
- In England, the average number of early deaths prevented is 1,189 per year, assuming that the hypothetical scenario is achieved in 1 year and the whole assessment period is 10 years.
- The number of early preventable deaths per 100,000 population per year is highest in North East England (3.6 deaths per 100,000 people) and the West Midlands (3.3 deaths per 100,000 people).
Promoting active travel and investing in measures to improve infrastructure for walking and cycling can deliver significant health benefits.
- The World Health Organization’s (WHO) health economic assessment tool (HEAT) tool uses data from published meta-analysis on the relative risk of death from any cause among people who walk or cycle regularly, compared with those who do not. The average relative risk estimates derived from the studies are then applied to the level of walking and cycling specified by users.
- The calculations are performed separately for different age groups: 20–49 years and 50–74 years for walking; 20–49 years and 50–64 years for cycling. The age groups for analysis in the National Travel Survey are slightly different from those in the WHO tool and the calculations have been adjusted to account for this.
- A take-up time of 1 year is assumed before the projected level of walking and cycling is reached. The whole assessment period is 10 years, which means that the benefits accumulated over a 10-year period are summed up and presented as an average per year.
- Walking and cycling rates refer to miles of travel per person per day. The tool assumes an average speed of 5.3km/hour for walking and 14km/hour for cycling. The all-cause mortality rates assumed in the model are 434 deaths per 100,000 people for walking and 249 deaths per 100,000 people for cycling.