Relationship between poverty, age and health
10 April 2024
Key points
- People in poverty are more likely to be in ‘less than good’ health (fair, bad or very bad) than people who are not in poverty at all ages.
- The difference in the share of people who report their health as less than good is largest for people aged 45–54 and 55–64 years (both 16 percentage points).
Poverty can affect health when financial resources are insufficient to meet basic living needs, such as adequate heating for the home, appropriate clothing or adequate nutrition.
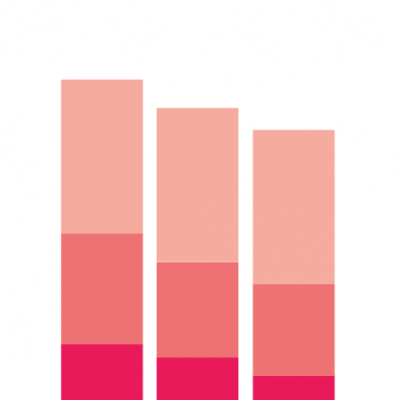
The chart shows the proportion of people who report their health as less than good (on a scale of ‘very good’, ‘good’, ‘fair’, ‘bad’ and ‘very bad’) by age and whether they live in poverty.
- Among people in poverty, the proportion of people whose health is ‘less than good’ is higher at all ages than for people who are not in poverty, revealing a clear gap.
- At age 16–24 years, the difference is 7 percentage points. At 25–34 years, it is 11 percentage points. At ages 35–44 the difference is 14 points.
- For people aged 45–55 and 55–64 years the difference rises to 16 percentage points.
- At ages 65 years and older, the two groups are more similar, with just 4 percentage points between them.
This gap remains even if we only look at people in work, which means the effect is not just a result of people with poor health being in poverty because their health prevents them from working.
- Poverty is defined as someone living in a household with a net household income below 60% of that year’s median.
- Income is equivalised which means it is adjusted for household size to reflect economies of scale: for example, a household of four needs more income for the same standard of living as a household of one, but not four times as much.
- Housing costs are deducted from income, to reflect that people with lower incomes in particular have fewer options for meeting their housing costs, relative to their income.
- Self-rated health is measured on a five-point scale from ‘very good’ to ‘very bad’. Other options include ‘good’, ‘fair’ and ‘bad’.
- Data for 2020/21 is not included in line with the Department for Work and Pensions’ guidance related to data quality during the COVID-19 pandemic.
- Figures for 2020/21, and 2021/22 data have been affected by the pandemic and are subject to additional uncertainty. They should be viewed with caution and considered alongside longer-term trends.
Source: Health Foundation analysis of Department for Work and Pensions, Households Below Average Income and the Family Resources Survey, UK, 1994/95–2021/22