Trends in income growth for working-age and pensioner households
30 October 2023
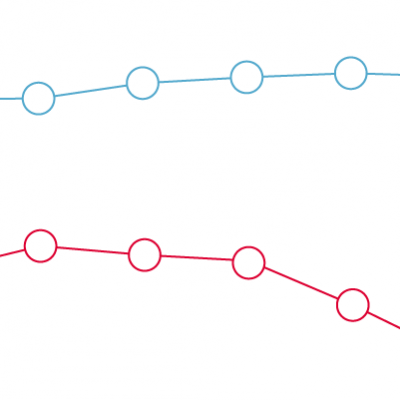
- Pensioner families’ median net household income has nearly doubled between 1994/95 and 2021/22.
- Over the same period, working-age families’ household income has grown by 50%.
Inadequate income can be a source of stress and limit access to goods, services and social participation, which are all necessary for good health. A lack of income growth can limit improvements in health.
This chart shows growth in the median incomes of pensioner and working-age households since 1994/95. The category ‘pensioner household’ is used by the Department for Work and Pensions and is defined as a household where at least one person is above the state pension age.
- Income growth has been slow for both pensioner families and working-age families since the early 2000s.
- Since 2010, there has been policy protection for pension incomes through the triple lock on State Pensions. This guarantees that the State Pension will not lose value relative to the higher of earnings or price growth or 2.5%. In comparison, working-age benefits have either been frozen or increased by less than inflation in most years since 2010. Earnings have also grown by less than inflation in most years.
- Pensioner families incomes, which have been historically lower than those of working-age households, overtook working-age incomes in 2020/21.
Growth in income for working-age households has been poor since the financial crisis of 2009 and was experiencing a slowdown before then. If household income does not improve, this risks younger age groups being unable to match the improvement in health that older age groups have experienced through their working life.
- Income is equivalised (adjusted for household size) and expressed after housing costs have been deducted from income. The underlying figures are adjusted for inflation and presented in constant CPI price terms.
- Please note that data for 2020/21 have been excluded from analysis due to concerns with bias in the sample.
- The category ‘pensioner households’ is the technical term used in the Households below average income (HBAI) statistics, produced by the Department for Work and Pensions. ‘Pensioner’ is not our preferred wording at the Health Foundation but is accurate to use in this context.
Source: Health Foundation analysis of Department for Work and Pensions, Households below average income (HBAI), Great Britain/United Kingdom, 1994/95 to 2020/21.