Relationship between income and health
21 December 2022
Key points
- 31% of people on the lowest incomes report ‘less than good’ health. In the middle (the fifth income decile) this figure is 22% and for people on the highest incomes the figure is 12%.
- Across the income spectrum, improving your income is associated with improvements in health.
Money and resources can affect health in a number of ways. Firstly, people need a certain level of income to be able to afford the basics for a healthy life, such as food and quality housing. Higher incomes enable people to have more choice, and this often means they have access to healthier options.
However, beyond a basic level of income, stresses still exist and can eventually harm physical health. This means that a high income does not guarantee good health outcomes.
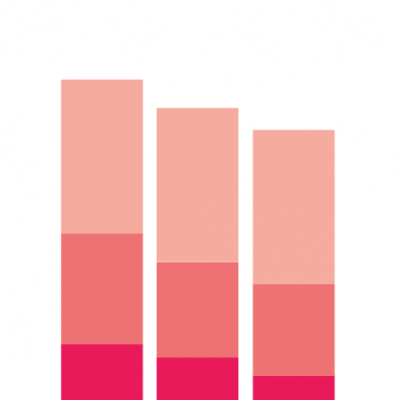
This chart shows UK adults aged 55 years and under by their self-rated health, grouped into 10 equal-sized bands (deciles) based on their household income in 2019/20.
- More than 10% of adults on the lowest incomes report having ‘bad’ or ‘very bad’ health, compared with 6% in the middle decile and around 1.5% on the highest incomes.
- Including data for ‘fair’ health (the category below ‘good’ health), 31% of people on the lowest incomes report less than good health, compared with 22% in the middle two deciles (5th and 6th), and 12% on the highest incomes.
Across the entire income distribution, higher income is associated with better health. This suggests that the relationship we observe between income and health goes beyond individuals being able to afford basic needs. At any level of income, more money correlates positively with health.
Poverty is both a cause and a consequence of ill-health, but is not inevitable. It can be addressed with the right policies and co-ordinated action on the different factors that can push people into poverty and keep them there. This means taking action on the cost of living, the availability of affordable housing, improving the quality of work and education, and building an adequate social security system that supports any of us when we don’t have enough to meet our needs. Policy must also take account of the inequalities affecting particular groups of people, including disabled people and carers, single parents, and people from minority ethnic backgrounds.
- Self-rated health is a measure of health on a five-point scale from ‘very good’ to ‘very bad’. Other options include ‘good’, ‘fair’ and ‘bad’.
- Income deciles are calculated by ordering incomes from lowest to highest across the distribution and dividing them into 10 equal groups. Decile 1 represents the lowest 10% of incomes, while decile 10 represents the highest 10% of incomes.
- Income is adjusted for household size to reflect economies of scale: for example, a household of four needs more income for the same standard of living as a household of one, but not four times as much.
- Housing costs are deducted from income, to reflect that people with lower incomes in particular have fewer options for meeting their housing costs, relative to their income.
Source: Department for Work and Pensions, Family Resources Survey 2020