Inequalities in households experiencing housing problems
27 April 2023
- Households on the lowest incomes are far more likely to have at least one housing problem.
- Households that are headed by someone from a minority ethnic group or a younger adult are more likely to have at least one housing problem.
Problems with people’s homes – non-decent homes, overcrowding and unaffordable costs – can influence their health. Non-decent homes include problems such as damp and cold, which can directly harm health. Overcrowding and poor affordability can cause stress and influence mental health. If someone experiences more than one of these problems, this risks further harm to their health.
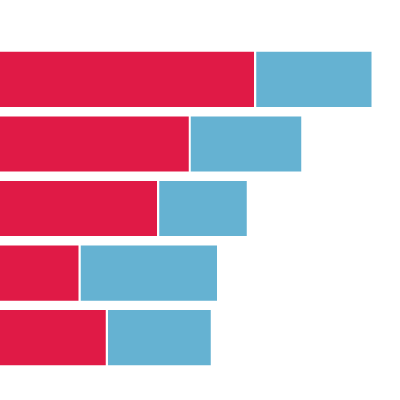
These charts show the percentage of people experiencing one or more housing problems by age, ethnicity and income.
Income
A significantly higher proportion of households on the lowest incomes (in the bottom 20% or quintile of the income distribution) have one or more housing problems (71.1%) compared with households in the second-lowest income quintile (38.9%).
A total of 16.3% of households in the lowest income quintile experience multiple housing problems, compared with less than 5% for all other income quintiles.
Ethnicity
Just under half the households (45.7%) from minority ethnic backgrounds experience a housing problem, compared with 30.4% of those of white ethnicity. Households headed by people from minority ethnic backgrounds are also more than three times as likely to experience two or more housing problems.
Age
The age group most likely to experience housing problems are 16–29 year olds (42%), compared with 28.1% of people older than 65 years. People in the 16–29 year old age group are also most likely to be renting, and people who are renting are more likely to experience multiple housing problems.
Housing problems, and particularly households experiencing multiple housing problems, are unequally distributed across society. People who are disadvantaged by their housing are likely to be disadvantaged in other areas, such as income, as well.
- Non-decent homes are defined as those with a Category 1 hazard – as assessed by the Housing Health and Safety Rating System (HHSRS) – that are not in a reasonable state of repair, lack reasonably modern facilities or are not warm enough (do not provide a reasonable degree of thermal comfort).
- Overcrowding is measured by comparing household members against a bedroom standard. This standard allows for the number of rooms a household needs, based on the relationship status of adults in the household, and the age and sex of the children.
- Unaffordable housing is where more than a third (33%) of household income (net housing benefit) is spent on housing costs.
- Please note that this data has been updated to 2018/19. English Housing Survey 2020 did not inspect homes because of covid restrictions so decent homes variables are not available.
Source: Ministry of Housing, Communities & Local Government, English Housing Survey, 2018/19.