Trends in people needing emergency temporary accommodation
27 April 2023
- By the end of June 2022 there were almost 95,000 households living in temporary accommodation, a 95% increase since 2011.
- More than three-fifths (62.3%) had children.
Being threatened with homelessness is a stressful experience, linked to psychological distress and depression. Additionally, 18% of all households living in temporary accommodation were in unsuitable accommodation in 2022. This can mean living in damp and cold conditions that have a direct impact on physical health, or overcrowding that creates a further risk of contracting infectious diseases.
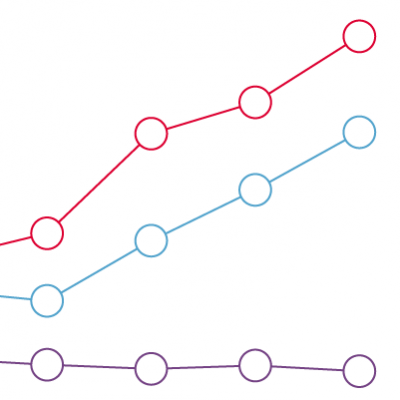
This chart shows the number of households that have been placed in temporary accommodation in England since 2005 – people who have been classed by their local authority as being, or becoming, homeless and in need. The data includes households with and without children, and households placed in unsuitable accommodation.
Temporary accommodation is accommodation funded by councils that is typically a private flat, a council or housing association flat, a room in a bed and breakfast establishment or a hostel.
In June 2022, there were 94,935 households in temporary accommodation and 62.3% had children. The proportion of households with children in temporary accommodation has been slowly decreasing since a peak of 79% in 2016.
The overall number of households in temporary accommodation has risen by 95% since 2011:
- From 2004 to 2010: the number of households in temporary accommodation fell by around 50%, which may reflect a change in legislation in 2002. This legislation stipulated that local authorities had a statutory obligation to reduce and prevent homelessness.
- Since 2011: the number of households in temporary accommodation has risen steadily alongside changes to the social security system. This includes a reduction in housing benefits that did not rise in line with increasing private rent costs.
- From April 2018: the Homelessness Reduction Act (HRA) broadened priority-need eligibility, with the intention of preventing homelessness. This legislation qualifies people for access to services, emergency housing or in some cases longer-term housing. It also extended the time for people to become eligible for help before they lose their home.
- From the start of 2020: there has been no further increase in the number of households in temporary accommodation, with the total count having stabilised at around 95,000. The number of households in temporary accommodation with children has also remained roughly stable since 2018 and the number of households with children placed in unsuitable accommodation has fallen by almost 50% since 2018.
- It is too early to fully judge the effectiveness of these new measures. For many local authorities the funding allocated does not meet their financial requirements.
There was a sharp spike in households without children claiming temporary accommodation between 2019 and 2021 – a 50% increase compared with December 2019. This is due to efforts to place people sleeping rough in temporary accommodation at the start of the COVID-19 pandemic in the first lockdown.
The increasing number of households in temporary accommodation since 2011 highlights the consequences of reducing both housing benefit to people who need it and funding to councils. This reduction in funding to councils has also resulted in less funding towards homelessness prevention.
The data in the chart are administrative statistics, reflecting the actions taken by local authorities to address homelessness. This means they may be subject to local differences in recording practice and issues around informal local restrictions (gatekeeping) in who can access the services.
Unsuitable accommodation has been defined as accommodation that is not separate and self-contained. It also includes situations where toilets, personal washing facilities or cooking facilities are shared by one or more households. For this analysis this includes households placed in bed and breakfast establishments, hostels and where no accommodation has been allocated.
Note that the data point for 2022 is at the end of Quarter 2.
Source: Ministry of Housing, Communities & Local Government, Statutory homelessness tables, 2022.