Mortgage and landlord repossessions across English local authorities
27 April 2023
- A total of 9 out of the 15 areas with the highest number of landlord and mortgage repossessions per 1,000 households in 2022 were in London.
- The North East was the region with the second-highest repossession rate after London at 1.2 per 1,000 households. Sunderland had the highest rates in the region with 1.7 repossessions per 1,000 households.
- There were 21,332 repossessions in England in 2022. Birmingham City Council had the highest number at 428 repossessions, although other areas, such as London, had higher rates per 1,000 households.
Insecure housing poses a risk to health, as it can undermine people’s sense of control over their environment and cause stress. Research has found that accumulating housing cost arrears, housing payment problems and imminent eviction and/or repossession can have a considerable impact on psychological wellbeing.
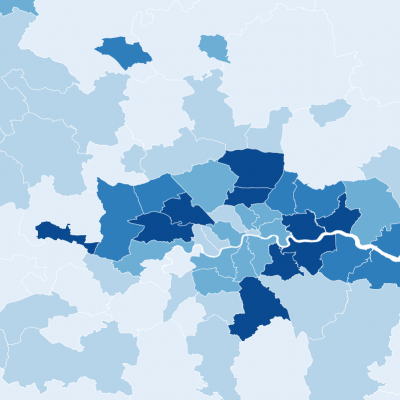
This map shows the number of mortgage repossessions (homeowners) and landlord repossessions (private and social renters) per 1,000 households in English local authorities in 2022. Repossession is defined here as carried out by county court bailiffs, although in some cases repossessions may take place through less formal procedures that are not counted in these figures.
- Slough, Hastings, and local areas in London had the highest rates of repossession in 2022. In Slough there were 2.9 repossessions for every 1,000 households and this rate was closely followed by Hastings, where the rate was 2.8 repossessions per 1,000 households.
- Boroughs in outer London had higher rates than those in inner London, with rates of 1.7 and 1.3 repossessions per 1,000 households respectively. This pattern, coupled with high rates in South East areas that were close to the London boundary, such as Slough (2.9 per 1,000 households), Dartford (1.8 per 1,000 households) and Gravesham (1.6 per 1,000 households), aligns with research suggesting the increase in poverty in suburban areas of cities, such as London.
- The North East was the region with the second-highest repossession rate after London at 1.2 per 1,000 households. Sunderland had the highest rates in the region with 1.7 repossessions per 1,000 households.
- Areas in South West England had the lowest rates of repossession at 0.6 per 1,000 households. However, Torbay stands in contrast to other local authorities in this region, with 2.1 repossessions per 1,000 households.
Areas in London and South East England with typically higher housing costs may have higher rates of repossession as people find it harder to meet mortgage and rent payments. Housing is traditionally cheaper in North East England, but weaker labour markets and higher rates of unemployment may result in people being unable to meet housing payments.
In response to the pandemic, the Coronavirus Act 2020 was introduced in March 2020 and this had several implications for the repossession process. Ongoing repossessions were suspended from March to September 2020, and from August 2020 to May 2021 the notice period ahead of repossession proceedings was extended to 6 months. Also, bailiffs could not repossess properties during national or local lockdowns in England.
Currently, the rate of repossessions is rising again. This likely reflects the relaxation of the COVID-19 laws and also the cost of living crisis, leading to rising rents, housing costs and wider financial pressures.
The risk of losing a home varies across England. Typically, rates of repossession are thought to be highest where housing costs are highest, relative to earnings. While this theory still largely holds true, the map shows that areas of high deprivation and low housing costs can also face high levels of evictions and repossessions. Therefore, support is needed in areas with both high and low housing costs.
An increase in housing benefit could improve affordability for social and private renters in areas with high and low housing costs. This financial support is needed in the short term, along with a simultaneous increase in the social share of housing stock and building new affordable homes for the future.
- In this analysis, the quarterly statistics for mortgage and landlord repossessions have been aggregated to create a 2022 total for each local authority in England.
- The repossession data are based on the address of the defendant (the person whose home is being repossessed). This means that in some mortgage repossession cases, where defendants have a second home or a buy-to-let mortgage in a different local authority to their current address, counts do not necessarily reflect local repossessions accurately.
- The number of households originates from the Office for National Statistics 2021 Census.
Source: Ministry of Justice, Mortgage and Landlord Possession statistics: 2023, Mortgage and landlord possession statistical data; Office for National Statistics, Census 2021.