Households owed homelessness prevention and relief duties by local authority
31 August 2021
-
The rate of households owed a homelessness prevention or relief duty is higher in London and urban areas generally, particularly the North West region. Some areas in the South East region and South West region also have a high rate of households owed a homelessness prevention or relief duty.
-
Areas in the East Midlands tend to have lower rates of households owed a homelessness prevention or relief duty.
-
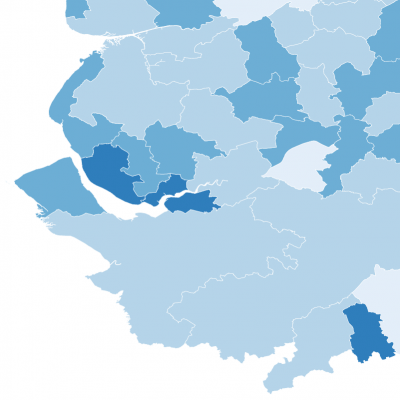
In Ipswich, the rate of households owed a homelessness prevention or relief duty is 6.7 per 1,000 households, which is the highest in the country.
The chart shows the rate of households owed a homelessness prevention or relief duty on initial assessment in each local authority from October to December 2020 in England. Local authorities must initially establish whether someone applying for accommodation or help with finding somewhere to live is owed a prevention or relief duty. These duties are placed on local authorities to secure accommodation for people who qualify as homeless (relief duty) or to take reasonable steps to prevent homelessness for those who are threatened with losing their home within 56 days (prevention duty).
The rate of households owed a homelessness prevention or relief duty is higher in urban areas, particularly in London and the North West region, but some rural areas also have a high rate, such as North Devon (4.9 per 1,000 households).
- A total of 105 of the 153 areas classified as rural areas or towns have a homelessness prevention or relief duty rate below two per 1,000 households.
- Eight of the 22 local authorities with the highest rates of households owed a homelessness prevention or relief duty are in London. A total of 12 of the 50 local authorities with the lowest rates of households owed a homelessness prevention or relief duty are in the East Midlands, but cities in the region, such as Derby (5.0 per 1,000 households) and Nottingham (5.4 per 1,000 households), have some of the highest rates in England.
- The rate of households owed a homelessness prevention or relief duty is highest in Ipswich (6.7 per 1,000 households), Manchester (6.2 per 1,000 households), the London Borough of Southwark (6.0 per 1,000 households) and Stockton-on-Tees (6.0 per 1,000 households).
- Conversely, the rate is as low as zero per 1,000 households in South Staffordshire and lower than 0.5 in Chichester and Ribble Valley.
The experience of homelessness harms mental health, and shelter (when available) may be overcrowded and poor quality, which can also harm health directly.
The Coronavirus Act 2020 led to the suspension of repossession cases and the extension of notice periods to 6 months from August 2020 to May 2021. These interventions are linked to a 7% fall in the number of households owed a prevention or relief duty from October to December 2020, compared with the same period in 2019. However, this still equates to 64,000 households needing support during this time. Assessing 2020 as a whole, the effect of these interventions has been subdued, with the level of homelessness prevention or relief duties owed down 3% compared with 2019.
Both housing benefits and funding to councils have been reduced in recent years, and this includes funding for programmes designed to prevent homelessness. A combination of these factors has increased the number of households facing the health-damaging consequences of homelessness, as well as increasing costs for other parts of the system, such as emergency temporary accommodation. The temporary cessation of evictions in 2020 in response to the coronavirus pandemic may have eased these pressures, but this measure has now ended.
- On initial assessment by a local authority, a prevention duty is owed if an individual is threatened with homelessness within 56 days. If an individual is already homeless, they will be owed relief duty.
- The local authority must take reasonable steps to prevent an individual from becoming homeless or help individuals that are already homeless to secure suitable accommodation. This can involve helping the individual to stay in their current accommodation or finding them a new place to live.
- The data in this analysis cover duties owed on initial assessment only. If homelessness is not resolved after the relief duty, an individual may be owed a main housing duty. Individuals owed a main housing duty are not covered here.
- Brighton and Hove, Charnwood, Dartford, Eastbourne, Harrogate, Hounslow, King's Lynn and West Norfolk, Lancaster, Lewes and Milton Keynes did not provide accurate data between October and December 2020 and are not included.
- Areas are classified as rural areas and towns using the Office for National Statistics Area Classification (including, Affluent England, Countryside Living and Town and Country Living).
Source: Ministry of Communities, Housing, and Local Government, Live tables on Homelessness, Great Britain: October to December 2020, Office for National Statistics, Household projections 2018 based, local authorities and higher administrative areas within England, mid-2001 to mid-2043