Proportion of population reporting good health by age and deprivation
6 January 2022
Key points
-
The share of the population in good health deteriorates as people age. However, this happens earlier and at a faster rate for men and women living in the most deprived 10% of local areas than for those in the least deprived 10%.
-
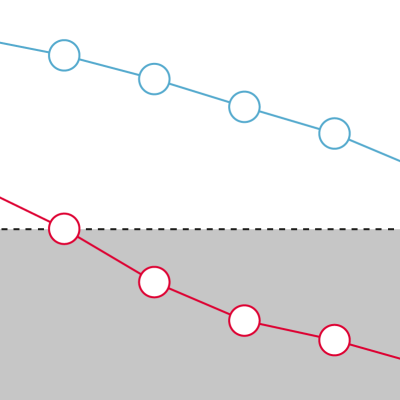
At age 60–64, 81% of people living in the least deprived areas report good health, compared with just 45% in the most deprived areas.
-
By age 55–59, more than half of people living in the most deprived areas report having less than good health. For those living in the least deprived areas, this occurs 20–25 years later, at age 75–79 for women and 80–84 for men.
This chart shows what proportion of the population report good health by age, sex and deprivation decile. Deprivation deciles are defined by ranking neighbourhoods by level of deprivation and dividing into 10 equal groups using the Index of Multiple Deprivation (IMD) 2015 rankings.
- In the most deprived 10% of local areas, half of men and women report poor health by age 55–59. In the least deprived areas, this does not occur until age 75–79 for women and 80–84 for men: 20 to 25 years later.
- For the first 30 years of life, the gap in reported good health between people living in the most deprived areas and those in the least deprived remains small (less than 7 percentage points). However, by age 60–64 it widens to 36 percentage points.
- At age 90 or over, one-third of men living in the least deprived areas report having good health, compared to just one-fifth in the most deprived. Similarly, of women aged 90 or over, 26% in the least deprived areas report having good health, compared with just 17% in the most deprived areas.
This chart highlights that improving health requires action throughout the life course. Less than good health is not only a problem of old age: it can occur at any age, including in the working-age population – particularly for those living in the most deprived areas.
For people in the most deprived areas, poor health is more likely at an earlier age than for those in the least deprived areas. The government has acknowledged the need to ‘level up health’ and the importance of health to economic prosperity. There is a need for a cross-government strategy to improve health and health equity, with a focus on the wider factors – beyond health care and social care – that influence our health.
- The Index of Multiple Deprivation (IMD) is the official measure of relative deprivation for small areas in England. It takes account of a broad range of social and economic indicators. The index ranks every small area in England from most deprived to least deprived and divides them into 10 equal groups ('deciles'). Decile 1 represents the most deprived 10% of local areas, while decile 10 represents the least deprived 10%. This chart uses the IMD 2015, built from 2011 Lower Layer Super Output Areas (LSOAs).
- In this instance, self-rated health is a measure of health from the Census, on a five-point scale from ‘very good’ to ‘very bad’. Other options include ‘good’, ‘fair’ and ‘bad’. Good health relates to people reporting their health as ‘very good’ or ‘good’.
- The Census is a household survey – so for the health status of younger age groups, parents or guardians are reporting on behalf of their children.
Source: Office for National Statistics, Sex by age by general health – 2011 Deciles IMD2015 from LSOAs in England, 2016