Inequalities in age-standardised mortality rates
6 January 2022
Key points
- Since 2011, improvements in mortality rates for men and women have stalled – both on average, and in the most and least deprived areas.
- Mortality rates show stark differences by deprivation. In 2019, deaths in the most deprived 10% of local areas were 1.76 times higher per 100,000 for men – and 1.77 times higher for women – than in the least deprived 10% of local areas.
- Socioeconomic inequalities in mortality rates widened further in 2020, due to the pandemic. Men in the most deprived 10% of local areas were 1.92 times more likely to die over this period than those in the least deprived 10% areas. The corresponding figure for women was 1.83.
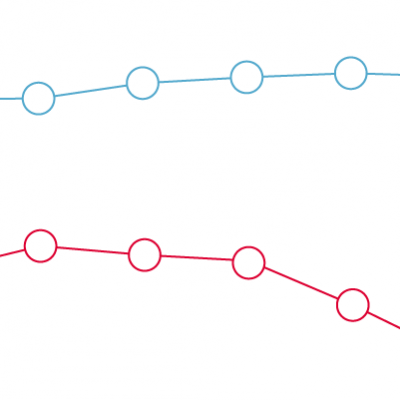
This chart shows the age-standardised mortality rate per 100,000 of the population for England from 2000–2020, comparing the most deprived 10% (decile 1) and least deprived 10% (decile 10) of local areas of England from 2001–2020.
The chart highlights the difference between overall mortality in two time periods: 2000–2011 and 2011–2019. Age-standardised mortality rates are adjusted for differences in the age distribution of a population, enabling comparability between areas. Deprivation deciles are defined by ranking neighbourhoods by level of deprivation and then dividing them into 10 equal groups, using Index of Multiple Deprivation (IMD) rankings for the closest corresponding year (see technical notes).
- Between 2000 and 2011, age-standardised mortality rates fell for men and women in England – both on average, and in the 10% most and least deprived local areas. During this period, there were 33 fewer deaths per 100,000 per year for men and 19 fewer deaths per 100,000 per year for women in England, after adjusting for differences in the age distribution of the population. Between 2011 and 2019, improvements slowed, with age-adjusted deaths per 100,000 decreasing by only 9 per year for men and 5 per year for women.
- During the period from 2001–2011 (when data is comparable for England and in the 10% most and least deprived local areas), men in the most deprived areas saw the largest absolute fall in age-standardised mortality rates: on average, by 35 deaths per 100,000 of population a year.
- Mortality rates show stark socioeconomic inequalities, as well as difference by sex. In 2011, mortality rates for men were 1.82 times higher in the most deprived areas compared to the least deprived. By 2019, the difference narrowed, to 1.76 times higher. In contrast, over the same period, the difference for women widened. In 2011 mortality rates for women were 1.69 times higher in the most deprived areas compared to the least deprived, but rose to 1.77 by 2019.
- The difference in rates of mortality observed for men and women by deprivation reflect different underlying changes. For men in the most deprived areas, mortality rates stalled from 2011 until 2019, when there was a strong year of improvement for mortality rates, reducing the gap between the most- and least deprived areas. For women in the most deprived areas, mortality rates gradually worsened from 2011 to 2018. There was a slight improvement in rates for women in the most deprived areas in 2019, but this was outpaced by improvements for women in the least deprived areas between 2011-2019, widening the inequality gap for women.
- In 2020, the pandemic led to increasing mortality rates for men and women in all areas. However, increases were sharpest in the most deprived areas, with mortality rates for men 1.93 times higher than for those in the least deprived areas. This reversed the improvements seen in 2019. For women, the inequality in mortality rates widened further, with women in the most deprived areas 1.83 times more likely to die over the period than those in the least deprived areas.
- For men in the most deprived 10% of areas in 2020, age adjusted deaths at 1,831 per 100,000 of population returned to rates last seen in last seen in 2007. For women, age adjusted deaths at 1,304 per 100,000 of population returned to rates last seen in 2004.
The pandemic has led to an increase in mortality rates and increased inequalities. However, even before the pandemic, improvements in mortality were stalling for all and declining for women in the most deprived areas from 2011 to 2018. Addressing a deep-rooted, society-wide trend of this nature requires action by a broad range of organisations. There is a need for a whole government strategy to improve health and health equity, with a focus on the wider factors – beyond health care and social care – that influence our health.
-
The Index of Multiple Deprivation (IMD) is the official measure of relative deprivation for small areas in England. It takes account of a broad range of social and economic indicators. The IMD ranks every small area in England, from most deprived to least deprived and divides them into 10 equal groups ('deciles'). Decile 1 represents the most deprived 10% of local areas, while decile 10 represents the least deprived 10%. This chart uses the IMD 2004 for data years 2001–2005, IMD 2007 for data years 2006–2008, IMD 2010 for 2009–2012, IMD 2015 for 2013–2017 and IMD 2019 for 2018–2020.
-
The top and bottom 20% (quintiles 1 and 5) age-standardised mortality rates up to 2018 are published by the Office for National Statistics. Quintiles 1 and 5 age-standardised mortality rates for 2019 and 2020 are Health Foundation calculations using mortality data from NOMIS, and IMD deciles for Middle Layer Super Output Areas produced by the University of Sheffield.
-
Age-standardised mortality rates for England up to 2018 are published by the Office for National Statistics. Rates for 2019 and 2020 are Health Foundation calculations using annual mortality and population statistics from the Office for National Statistics.
-
All estimates are age standardised per 100,000 of the population using the 2013 European Standard population.
Source: Health Foundation analysis of Office for National Statistics, Changing trends in mortality by national indices of deprivation, Deaths by sex and age group England,1995 to 2018; Vital statistics in the UK: births, deaths and marriages, 2020; Mid-year population estimates, England, 2000-2020; Mortality statistics for middle layer super output areas accessed via NOMIS.