Change in councils’ spending needs and their ability to raise revenue
3 April 2018
- Between 2006/07 and 2013/14, there was a slight positive correlation between increases in the relative need for adult social care spending and growth in local tax-raising capacity (from council tax and business rates) at a council level.
- This implies less risk of funding divergence across councils than if these variables were negatively correlated. But for individual councils, assessed needs and revenue-raising capacity still evolved in quite different ways.
- For example, 33 out of 151 councils saw their assessed relative spending need for adult social care spending increase and their relative tax-raising capacity fall, while 35 councils saw the opposite.
A new Institute for Fiscal Studies report, Adult social care funding: a local or national responsibility?, funded by the Health Foundation, argues that ongoing reforms to local government finance risk a growing funding gap for adult social care and conflict with efforts to provide consistent and high-quality care services across the country.
As a result of recent reforms, council’s general funding is not longer adjusted on an annual basis to reflect changes in local tax revenues and spending needs. These reforms were introduced to provide incentives to councils to grow local tax revenues, but some areas could lose out if their taxes don’t keep pace with demand for local services.
To see whether this risk is significant, the report looks at whether the spending needs and revenues of councils tend in the past to move in tandem or in opposite directions. It is when trends in the relative needs and relative revenues do not match (or, worse, go in opposite directions) that it becomes harder to deliver a consistent standard of services across councils.
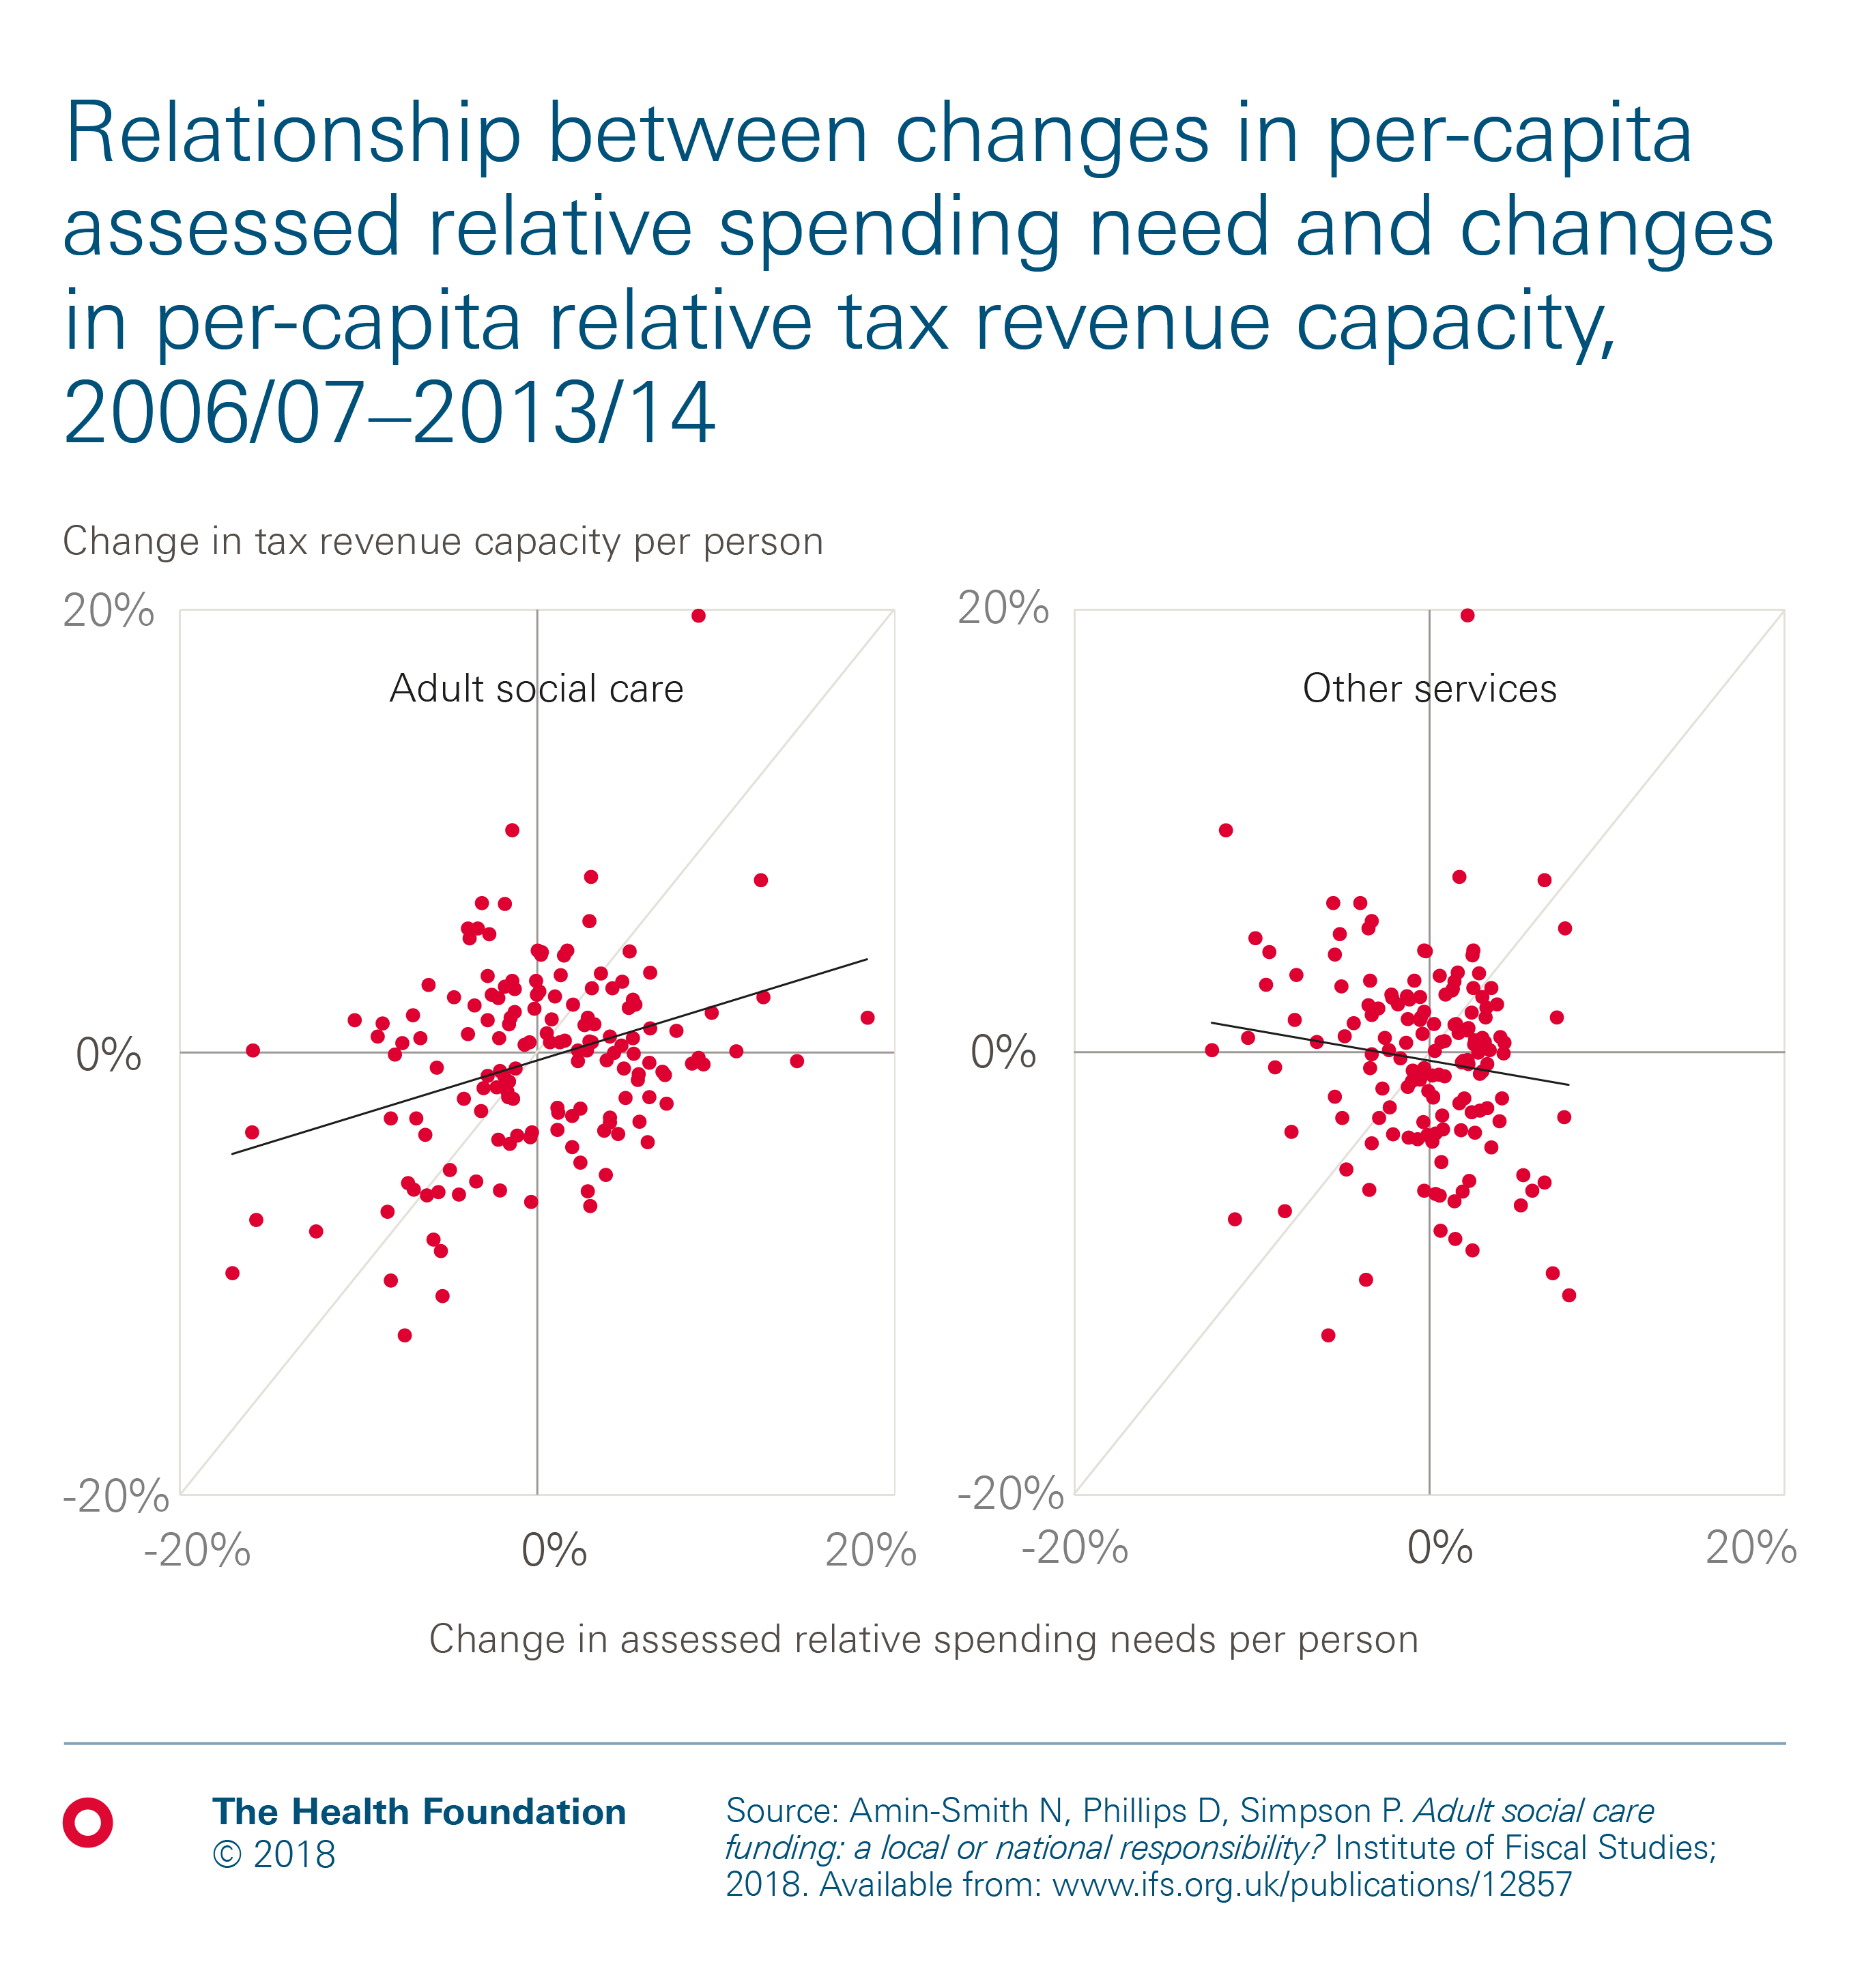
With this in mind, the figure above shows the relationship between changes in assessed relative spending needs per person and changes in relative tax revenue capacity per person between 2006/07 and 2013/14. As we are looking at changes in relative need (not absolute need), the average for England as a whole is 0%. Positive numbers indicate an increase in spending need per person relative to the average across all councils. Negative numbers mean that need has fallen relative to the average across all councils (but absolute need could still have risen). Similarly, changes in tax revenue capacity are also measured relative to the average change across England as a whole.
In fact, between 2006/07 and 2013/14, there was a slight positive correlation between increases in the relative need for adult social care spending and growth in local tax-raising capacity (from council tax and business rates) at a council level.
- This weak positive correlation implies less risk of funding divergence across councils than if these variables were negatively correlated. But for individual councils, assessed needs and revenue-raising capacity still evolved in quite different ways. For example, 33 out of 151 councils saw their assessed relative spending need for adult social care spending increase and their relative tax-raising capacity fall, while 35 councils saw the opposite.
- With councils bearing more of the change in local tax revenues and spending needs in future than in the past, if these trends continued, it could be hard to deliver a consistent standard of adult social care services across the country.
Changes in the assessed relative needs for other service areas (Panel B) were, on average, a little smaller than those for adult social care during this period. But there was effectively no correlation with changes in relative tax revenue capacity.
These patterns of changes indicate the potential for gaps to emerge between councils’ relative revenues and relative spending needs under the evolving local government finance system. Exposure to a higher share of the changes in business rates revenues (as under plans for 75% or 100% retention), longer periods between any re-equalisations of funding levels (termed ‘resets’), and making those re-equalisations only partial would all expose councils to more of the underlying risk of revenue and needs divergence. But they also provide stronger incentives for councils to grow their tax bases and tackle underlying spending needs. That is the tension between equalisation – to provide councils with the resources to provide comparable services – and financial incentivisation.
Related links
Work with us
We look for talented and passionate individuals as everyone at the Health Foundation has an important role to play.
View current vacanciesThe Q community
Q is an initiative connecting people with improvement expertise across the UK.
Find out more
