International comparisons of capital in health care: why is the UK falling behind?
International comparisons of capital in health care: why is the UK falling behind?
24 October 2019
Key points
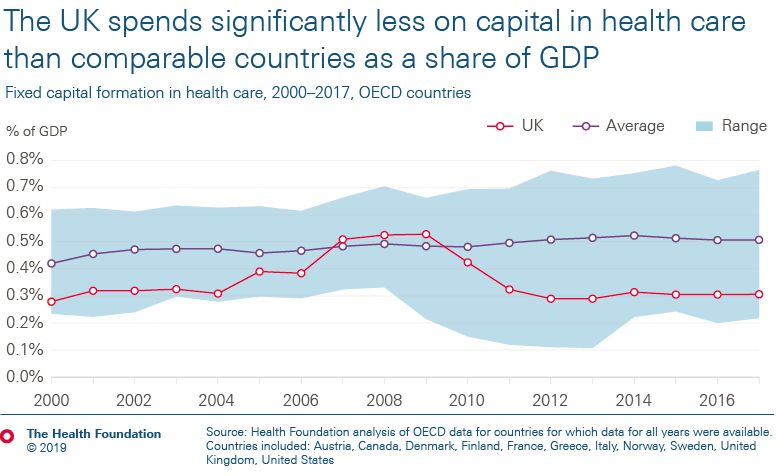
- The UK spends significantly less on health care capital – which includes buildings, machinery, equipment and IT – as a share of GDP than most other comparable countries.
-
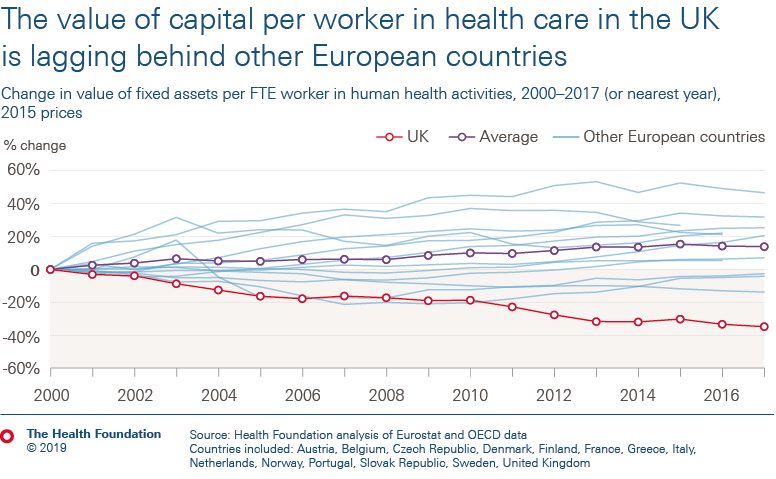
As a result of low capital spending, from 2000 to 2017 the total value of health care capital in the UK has fallen by 3% in real terms. Over this period, most other countries have seen significant increases in the value of their health care capital driven by higher spending.
-
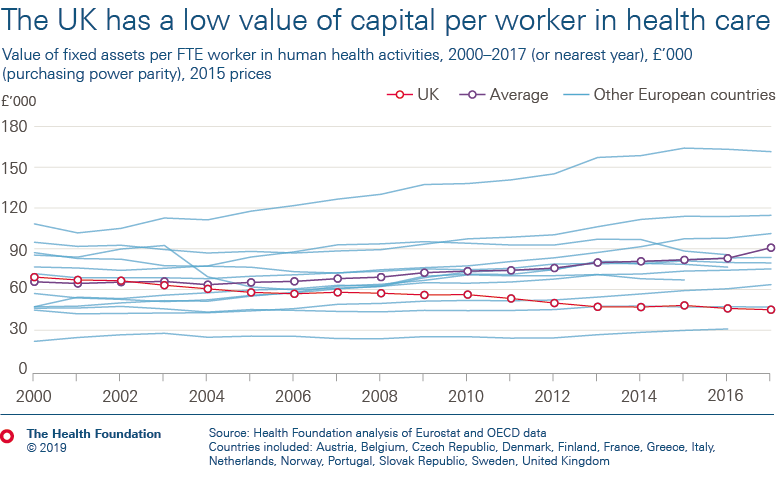
In the UK, the value of capital per health worker – which provides an estimate of the resources available to staff to deliver care to patients – has fallen by 35% since 2000. Many other countries have seen significant and consistent rises in capital per worker over this period. Of the countries analysed, the UK has the second lowest value of health care capital per health care worker (at just over half the average).
-
The value of machinery and equipment per health care worker in the UK is the lowest of all countries analysed and continues to fall – countries such as Austria and Denmark have more than five times the value per worker.
-
The data raise questions about why the UK is lagging so far behind other countries and concerns about what the implications might be for staff and patients. This reinforces our view that there is a clear need for a long-term capital settlement for the NHS in England – including a substantial funding increase – to address problems such as ageing estates and infrastructure, and to invest in new medical technology in the future.
-
Despite government announcements of new funding, we estimate an extra £2.5bn would be required in 2019/20 to bring capital spending in England up to the average of comparable countries.
Capital spending and capital value explained
Health care capital spending is used to finance long-term investment in buildings, equipment, medical technology and IT.
In the UK, the biggest contributor to capital spending is the DHSC’s capital budget, which is used for capital spending throughout the NHS in England. The recent government announcements of funding to upgrade hospitals or build new ones are examples of capital funding in the NHS.
Our previous analysis showed that the UK and the NHS lag far behind comparable countries in annual capital spending. While recent funding announcements will increase the capital budget significantly, they will still leave the NHS lagging behind comparable countries.

Annual capital spending contributes to a stock of capital. Capital stock is a measure of the value of capital. In health care, capital stock is the value of buildings, machinery, equipment, IT and other assets used in delivering services. From capital stock, health services can be delivered. For example, MRI machines will deliver a certain number of MRI scans over their useful life.
Capital stock declines in value over time through depreciation, and as assets age they may also be retired or scrapped. This value after depreciation is known as net capital stock, which is the measure of the value of capital we use in this analysis (see note 2 below).
Different values of health care capital between countries reflect a combination of things:
- The first is the amount of capital. More scanning equipment in one country will give a higher value of capital in that country.
- The second is age. As an asset declines in value over time, we expect it to deliver fewer services. An older machine may be able to deliver a similar number of scans this year but cannot be used for as long as a brand-new machine.
- The third is quality. For example, we expect newer IT infrastructure to be far more efficient than older infrastructure, and more efficient IT systems to be more expensive than less efficient ones.
- Lastly, there will also be differences in the price of assets between countries and changes in market prices over time.
The value of a country’s capital stock therefore provides a measurement of the quantity and quality of health services that can be delivered. A higher capital stock means we expect to be able to deliver more and/or better quality health care both now and in the future.
Capital is generally assumed to increase productivity and cross-country comparisons of health care capital may help explain some of the differences in the health care delivery we see across different countries. For more on how this analysis compares values of capital across countries, see note 3 below.
In the following sections we analyse trends in capital spending and the value of capital in health care in the UK compared to other OECD and European countries (see note 4 below). We estimate the total value of capital from 2000 to 2017 using capital stock data from Eurostat. Combined with labour data, we estimate trends in health care capital per worker in each of the countries. Capital per worker is a measure of the value of capital for each worker employed in health care, reflecting the resources available for workers to deliver health services.
- Comparing MRI and CT scanners across countries is difficult. In the UK the data is only on MRI/CT scanners provided by the NHS.
- Gross capital stock refers to the cost of buying the same asset new, rather than in its current condition.
- To compare the value of capital stock across countries we convert all data using Purchasing Power Parities (PPP). PPP exchange rates are used to adjust for price differences between countries. We converted the data to GBP using the PPP exchange rates for actual individual consumption (AIC) from the OECD.
- All data are at a UK level so include all four countries of the UK, along with the private and volunteer sectors.
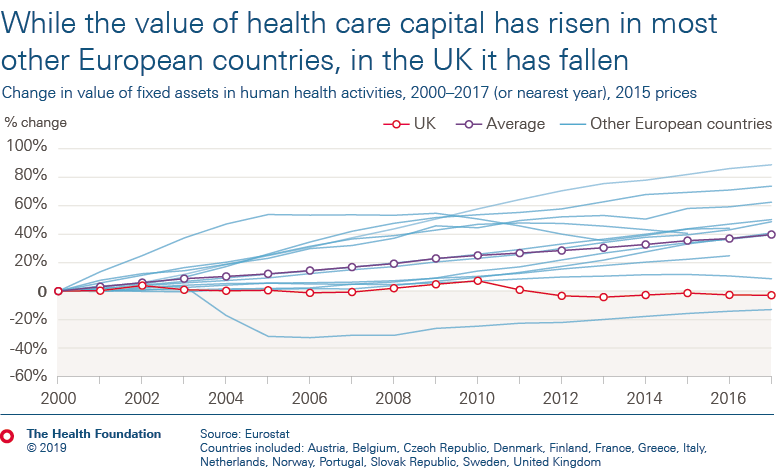
The data used to calculate capital values in the chart below relate to the net value of fixed assets in ‘human health activities’ and are obtained from Eurostat. This differs slightly from the definition used in the previous section for capital spending in the health care system from the OECD which includes some services considered to be social care in the UK (see note 1 below).
For example, residential care activities are not included in the definition of health care we use to calculate the value of capital. An advantage of this measure is that it offers a closer reflection of the services provided by the NHS. However, this is not necessarily the case for other countries where services such as residential care are considered as health care.
We use Eurostat data for our capital values as the OECD does not provide capital values solely for the health care system, only for ‘health and social work’. As a result, we consider that the Eurostat data provides the best available representation of capital values in health care. As not all countries report the data, we selected all countries with available data, excluding Luxembourg as it is an outlier.
International comparisons are challenging due to the way countries measure and deliver health care, and particularly social care. The values are based on assumptions which may differ between countries, for example, the length of time they expect capital to be used influences how much it depreciates each year.
There could also be price differences in the cost of capital. As the NHS is the single largest health care purchaser in these countries, it could be using its market power to purchase at lower costs. By using within-country indexes from 2000, we can reduce the impact of cross-country differences.
There are also differences in what is considered health and social care between countries.
For all the charts we repeated the analysis using the same data sources but with a broader definition which included all health care and social work. The trends for the UK remained similar. While there was an increase in the value of capital, there were still significant falls in capital per worker as a result of an increase in the workforce, and low levels of capital per worker when adjusted for exchange rates.
The analysis suggests that the UK’s health care capital spending is mostly focused on replacing existing capital as it deteriorates, while other countries are replacing capital at a faster rate than they are using it, leading to large increases in their health care capital stock.
Under standard industry classifications, the health data we use is industry 86 human health activities. For comparison, we also estimate capital stocks using health and social work industries, which is industries 87 and 88.

Machinery and equipment
The chart below shows the same ratio as the previous chart, but only using the value of machinery and equipment. The UK has had the lowest value in every year since 2006. Since 2006, other countries with low values are increasing while the UK has a declining trend.
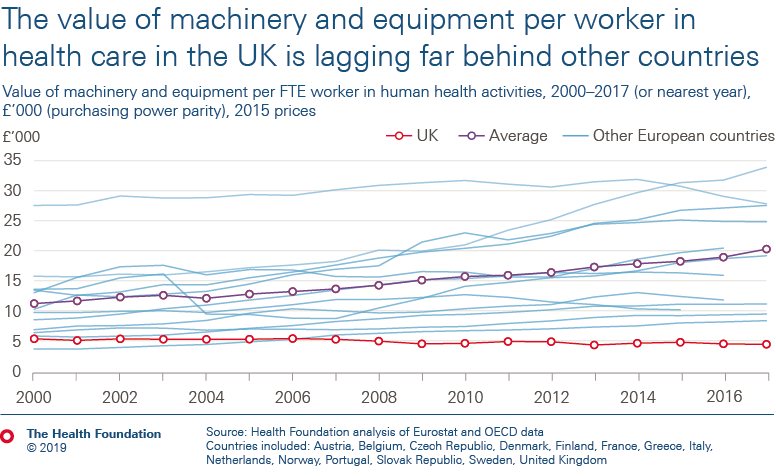
The data also shows that countries such as Austria and Denmark have more than five times the value of machinery and equipment per worker compared to the UK. However, it does not tell us what type of machinery and equipment it is, nor where it is in the health care system (in primary care or hospitals, for example). This may seem a very large gap, but it is consistent with the international comparisons of specific data we have on medical equipment. For example, Austria and Denmark have more than three to four times the number of CT scanners per capita. There could also be classification differences between countries, where some countries classify certain structures within buildings as machinery and equipment, while others do not.
For comparison to capital values, we use the same industry for health care workers in the previous section. This includes all health care workers in the UK, so will include those not substantively employed by the NHS. It also doesn’t reflect the type of health care workers.
- This is true unless prices are falling in the UK on medical equipment and technology while rising everywhere else. We do not expect this to be the case.
Further reading
Work with us
We look for talented and passionate individuals as everyone at the Health Foundation has an important role to play.
View current vacanciesThe Q community
Q is an initiative connecting people with improvement expertise across the UK.
Find out more
