Why before-and-after analyses can give misleading results
28 September 2018
If you want to know if a change in care makes a difference to patients’ outcomes, it seems logical to compare these patients’ outcomes before and after they received the intervention. This kind of evaluation is known as a ‘before-and-after analysis’ or ‘pre-post study’ and is widely used.
If patients’ outcomes change after the introduction of an intervention (for example, if after an intervention there are fewer emergency admissions), you might deduce that the intervention was successful in changing the outcome.
However, before-and-after analyses can suffer from something called ‘regression to the mean’. This is where, after an unusually high or low value, the next value will often be closer to the average. A colleague once described it as a bit like Bruce Forsyth’s Play Your Cards Right where you had to guess if the next card was higher or lower than the first: if the first card is a queen of hearts, the next one is likely to be lower.
The same statistical issue applies to evaluations of health care initiatives, especially if patients were chosen to receive the intervention because they were considered to have a greater need for it, for example because they had had deteriorating health or were recently admitted to hospital in an emergency. Over time, the average health or emergency hospital use of these patients will often improve, as a number recover from their illnesses. If you choose patients as they are at their most ill, you can expect that on average people will get better.
What ‘regression to the mean’ can look like
We can illustrate the principle of regression to the mean using data from a recent Improvement Analytics Unit report. This report looked at integrated care teams (ICTs), which aimed to provide more coordinated care tailored to their patients’ needs. GPs or other health care professionals selected patients for referral to ICTs based on their clinical judgement on who was at highest risk of going into crisis, had the highest needs and would most benefit from the multidisciplinary approach.
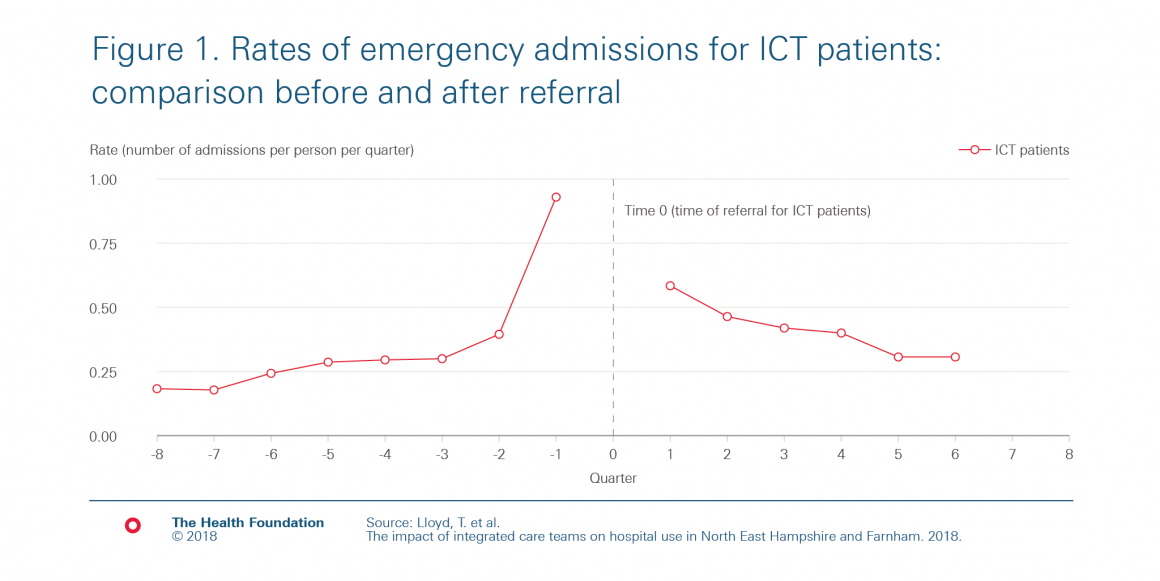
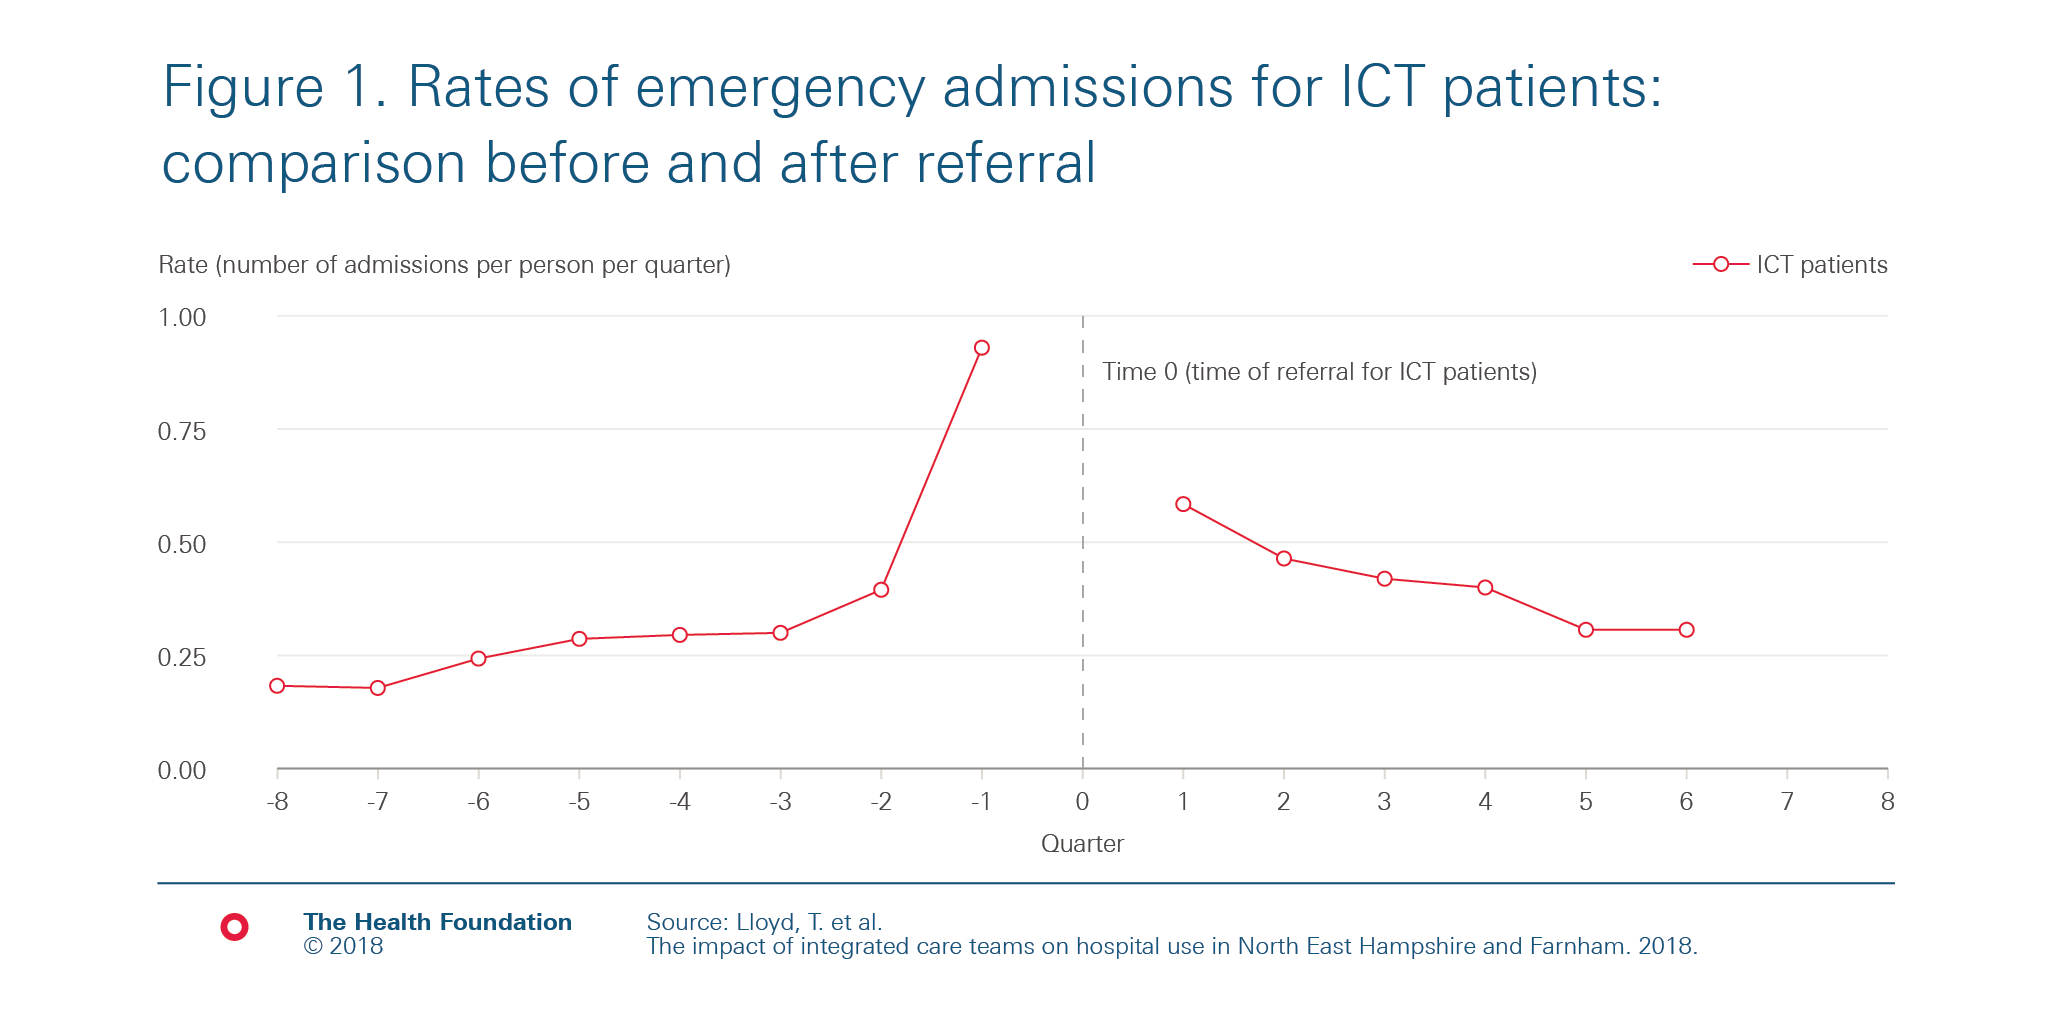
We examined whether patients being referred to an ICT had an effect on how often they subsequently went to hospital. In our study, we compared the referred patients to a different group of patients that were selected to be as similar as possible to the referred patients. However, if we had looked at the ICT patients’ emergency admissions over time before and after their referral, we would have seen the trends in Figure 1, which shows that the rate of emergency admissions (per person per quarter) drops for patients after they were referred to the ICTs.
In our study, instead of comparing outcomes before and after referral, we compared against a comparison group. This matched control group was chosen to be of similar age and gender, have similar prior health conditions and prior hospital use to the referred patients, as well as having access to all the same health care services, with the exception of the ICTs.
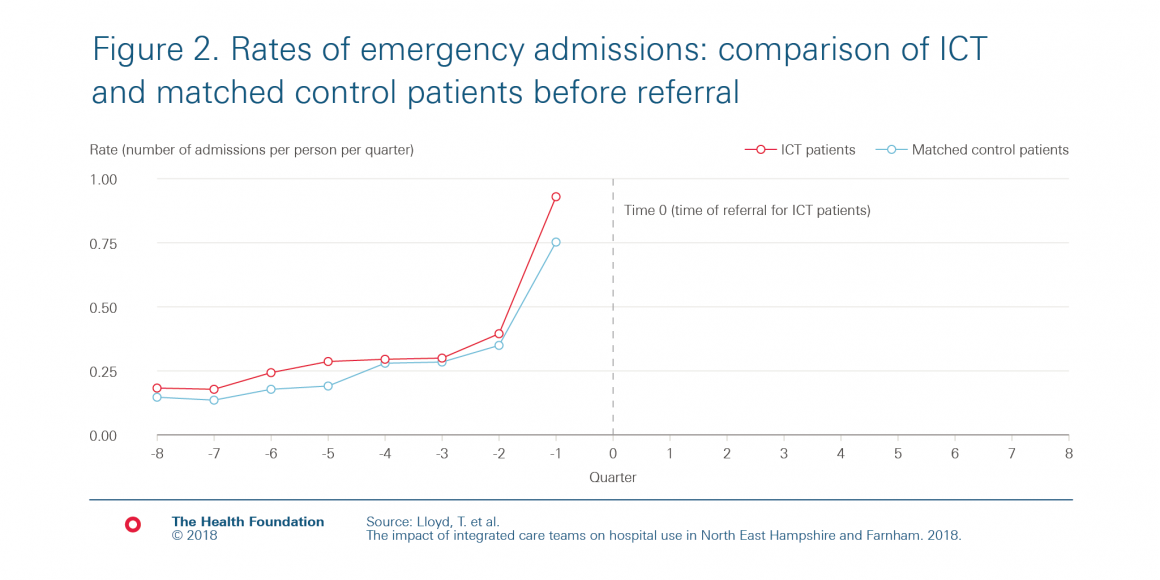
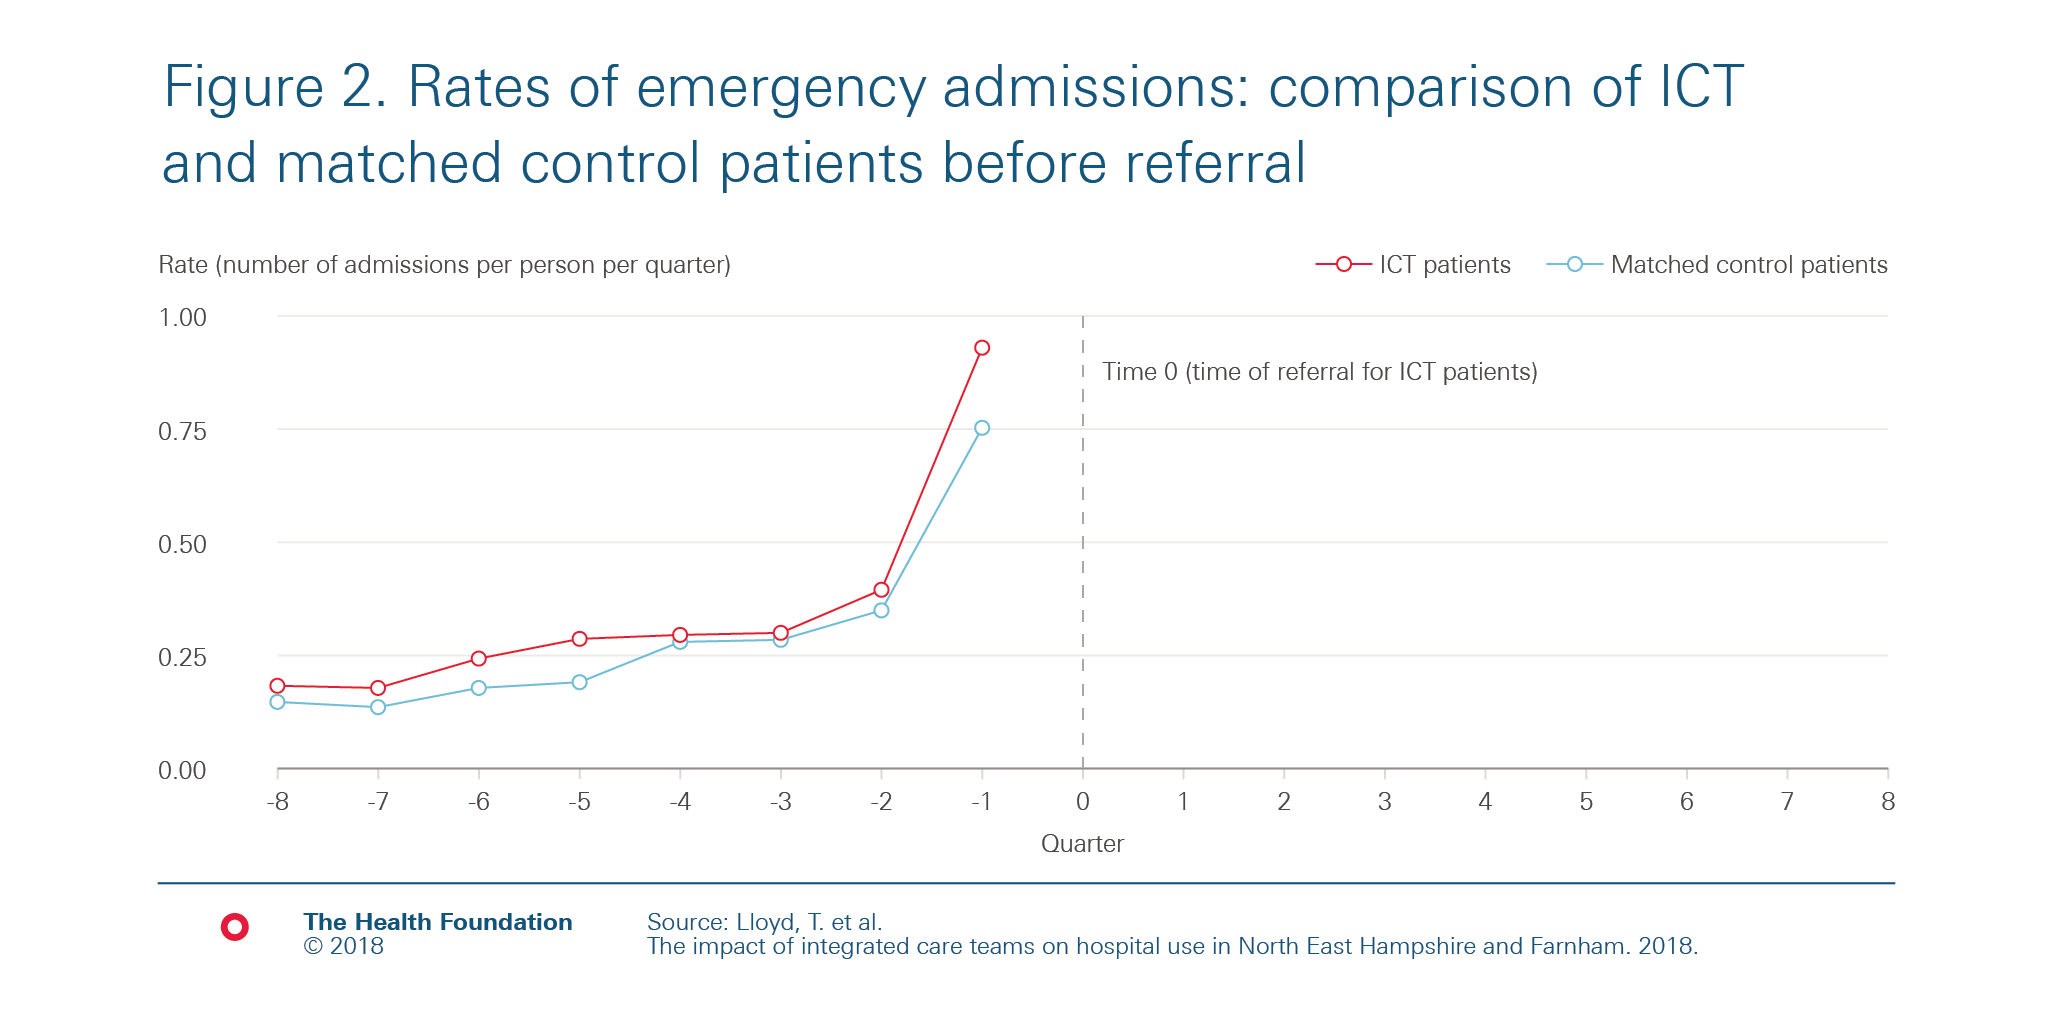
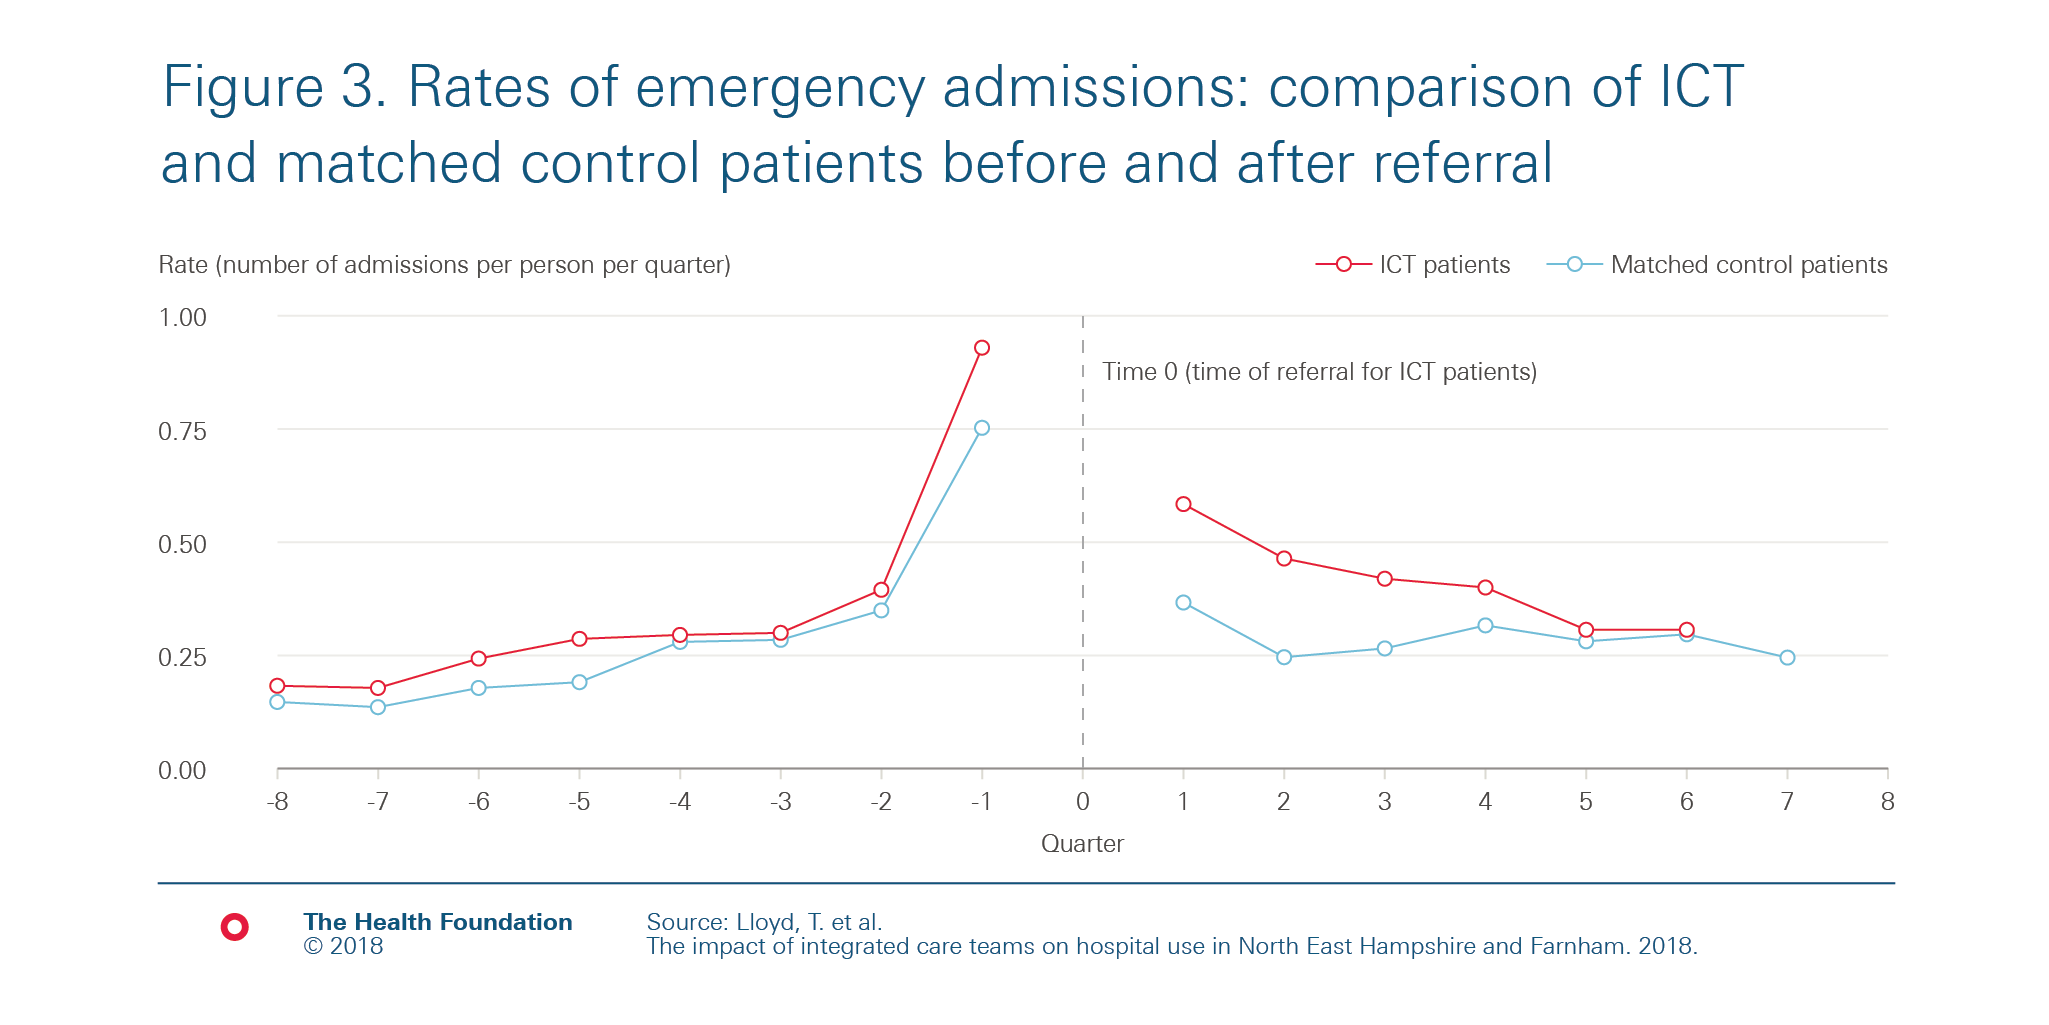
Figure 2 shows how both the referred patients and the matched control patients’ rates of emergency admissions changed over time in the period before ‘Time 0’. For ICT patients, time 0 is the date of referral to the ICTs. We can see from figure 2 that the ICT patients had a large increase in emergency hospital admissions in the three months before their referral. This makes sense, given how the GPs and others selected patients, as higher rates of emergency admission are often a sign of need.
The matched control patients did not receive an intervention. Therefore, ‘time 0’ is an arbitrary date, chosen so that the group is similar to the referred patient group in the period leading up to referral. We can see from figure 2 that we’ve succeeded in choosing a group of matched control patients with very similar trends of prior emergency admissions to the referred patients.
Once we had chosen our matched control group, we compared the rate of emergency admissions of the two groups after ‘Time 0’ (ie after referral) – the right-hand side of figure 3. The rate of emergency admissions drops for patients referred to the ICTs – but so does the rate for the matched control group, even though the matched control group didn’t receive any intervention at that time! The drop in emergency admissions in the matched control group is an example of regression to the mean.

This highlights why, if a before-and-after analysis shows an improvement in outcomes, it is difficult to determine if or how much of this improvement is due to the service change having been successful. In our study, if we had only had information on ICT patients, we might have mistakenly concluded that the ICTs led to an immediate decrease in emergency admissions. However, by comparing to a matched control group, we could see that that was not the case.
So what alternative methods are there?
Health care initiatives are often difficult to evaluate, often because of both the difficulty in accessing relevant data and because of the complexities of the service change and context. There are, however, a range of different methods that can be appropriate, depending on the context and data available. Core to many of these is having a comparison group, as in the example above where we used a matched control group of patients. Although none of these methods are perfect either, they can be more reliable than before-and-after analyses.
Therese Lloyd is Senior Statistician at the Health Foundation.
Work with us
We look for talented and passionate individuals as everyone at the Health Foundation has an important role to play.
View current vacanciesThe Q community
Q is an initiative connecting people with improvement expertise across the UK.
Find out more
