Understanding the needs of those most clinically vulnerable to COVID-19 Unanswered questions about the shielded population
Key points
- In March 2020, early in the coronavirus (COVID-19) pandemic, over 2 million people across the UK were asked to shield. These were people considered to be clinically extremely vulnerable (CEV) to COVID-19 and at high risk of serious illness.
- Over a third (38%) were identified as CEV because of a respiratory condition, 17% a rare genetic, metabolic or autoimmune disease and 14% due to being treated for cancer.
- The majority of conditions that result in people being considered CEV are chronic and require ongoing health and social care support. Any disruptions to care for this group are likely to have resulted in unmet need with significant implications for their longer term health.
- Our analysis of NHS Digital’s data on the shielded patient list finds that there were substantial variations in the proportion of the local population asked to shield across different local areas in England, with rates varying between 2.5% and 9.3% across local authorities.
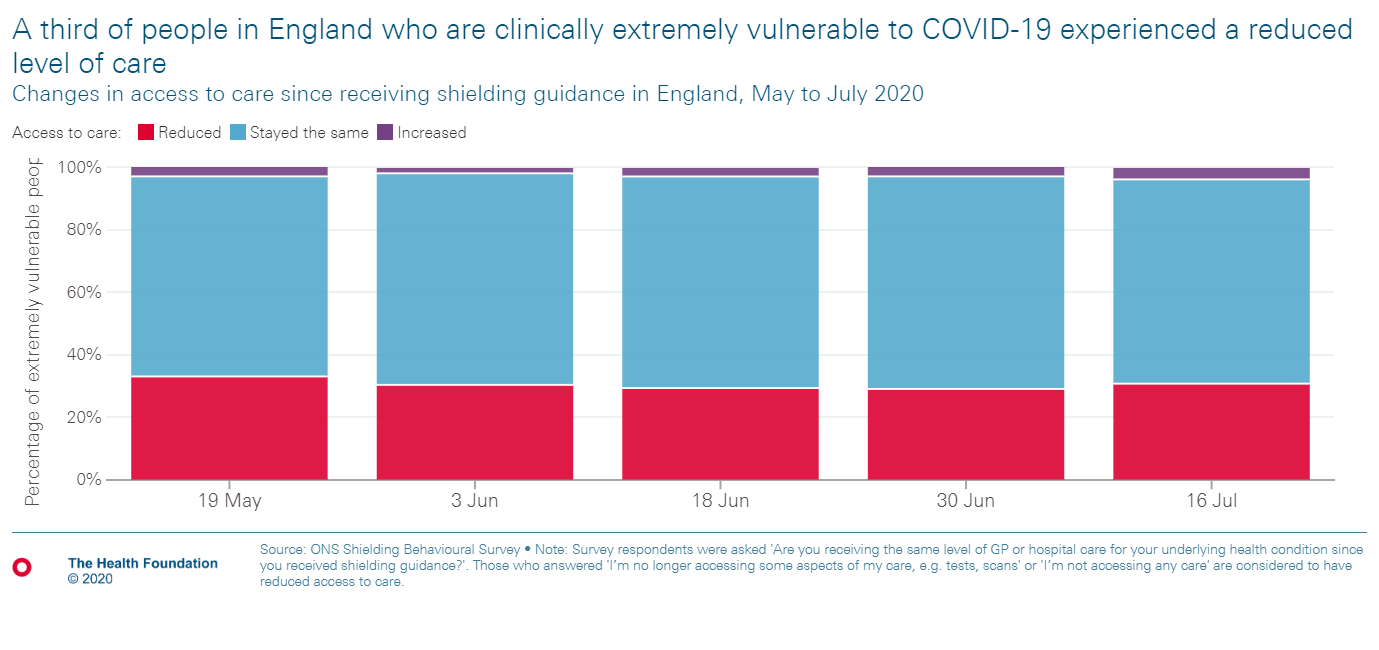
- Our analysis of ONS data shows that approximately one in three people (31%) who were shielding experienced a reduced level of care for their existing health conditions and one in ten people did not access any care at all.
- While this data gives some insight into the CEV population and their experiences during the first wave of the pandemic, there are still unanswered questions. A deeper understanding of the short and long-term impacts that the shielding policy has had on the health and wellbeing of people in this group is required. Without this, policies and services cannot be adequately designed and delivered to meet the needs of the shielded population.
Introduction
Those who are considered clinically extremely vulnerable (CEV) and at high risk of serious illness from COVID-19, also known as the shielded population, are more likely to be exposed to the risks of missed health care. This may be because of existing long-term conditions, social isolation and potential lost income if unable to work from home.
With levels of infection still high across many areas, uncertainty about future guidance for CEV people and the recent news that CEV people will be a priority group for the vaccine, it is essential that we understand more about this population and their experiences of the pandemic.
Earlier this year we announced that five partners had joined our Networked Data Lab – a pioneering collaborative network of analysts who will use linked data, open analytics, and public and patient involvement to tackle the most pressing challenges in health and social care. Our first analytical project will focus on the shielded population, a group of people who have been identified as a priority across our five partners.
This analysis is the first in a series from the Networked Data Lab that will examine the evidence on the CEV population. Here, we explore what we know about the CEV population from aggregated data published by NHS Digital and the ONS. We examine who was asked to follow shielding guidance during the first wave of the pandemic, the geographical and socioeconomic variation in those asked to shield and their experiences.
From 23 March 2020, people who were identified as being clinically extremely vulnerable and at high risk of serious illness from COVID-19 were contacted by letter and asked to shield. This practice was to protect these individuals from coming into contact with the virus by minimising their interactions with others. During this time, people were asked to stay at home at all times and to not come into contact with anyone who was not part of their household. The only exception to this guidance was for the purposes of medical care.
Shielding guidance was paused in August 2020 in most of the UK but reinstated during England’s second national lockdown in November, albeit with fewer restrictions. For those considered clinically extremely vulnerable, guidance continues to be updated across the country.
In England, people identified as potentially clinically extremely vulnerable to COVID-19 are added to the shielded patient list through a targeted scrape of health care records. This identifies people with certain conditions that place them at higher risk of serious illness from COVID-19. This is supplemented by direct additions from general practitioners. The shielded patient list is updated continuously as new risk factors are discovered, and clinically extremely vulnerable people are identified. A similar approach is followed in the devolved nations.
Who has been asked to shield?
Analysis of the NHS Digital data about people in England asked to shield shows that as of October, over a third (38%) have been asked to shield because of a respiratory condition, 17% because of a rare genetic, metabolic or autoimmune disease and 14% due to being treated for cancer. The majority of these conditions are chronic and require ongoing health and social care support. Any disruptions to care for this group of people is likely to have resulted in unmet need with significant implications for their longer term health.
Although age is not part of the criteria in the guidance for CEV people, almost two-thirds of those asked to shield in England are aged 60 or older; while 7.3% of those asked to shield are younger than the age of 30. This age distribution reflects that the conditions that place people at the highest risk of COVID-19 are more likely to present in older adults. There are small differences across gender, with 4.1% of women and 3.8% of men being asked to shield.
There are substantial variations in the proportion of people asked to shield across income deprivation. Of people living in the fifth most deprived local authorities, 4.2% of people have been asked to shield. In contrast, only 3.5% of those living in the least deprived areas have been asked to shield. The prevalence of long-term conditions, in particular respiratory conditions that put people at higher risk of serious illness from COVID-19, varies by socioeconomic deprivation. This may explain the variation seen in shielding across deprivation levels.
How do rates of shielding vary across local areas?
While 4% of people in England have been asked to shield, there are substantial variations in the proportion of people asked to shield across different local areas. In the North West, 4.8% of people were asked to shield whereas in the West Midlands this was only 3.6% of people. Differences at a local authority level are even starker with shielding rates varying between 2.5% and 9.3%.
Similar variations are seen across the UK nations. In both Wales and Northern Ireland, shielding rates were slightly higher than in England at 4.2%. However, the proportion asked to shield in Scotland was much lower at only 3.3%.
These differences are likely attributable to differences in the prevalence of long-term conditions putting people at risk of becoming seriously ill from COVID-19. However, there may also be differences in how local lists of shielded people are updated. Although the lists are created at a national level, GPs and hospitals are also able to add people to the list based on their assessment of an individual’s risk and vulnerability. Different approaches by GPs and hospitals to adding or removing individuals from the shielded patient list may result in differences in the proportion of the local population who are shielding across areas. There is currently no data available at a local level to explore this further.
Variations across local areas have important implications for how services are arranged and delivered to ensure that this group of people is still able to receive the health and social care they need, as well as being able to participate in society while still being protected from COVID-19.
Were those shielding able to access health care?
The results of the ONS Shielding Behavioural Survey revealed that by the middle of July, approximately one in three people (31%) who were shielding in England experienced a reduced level of care for their existing health conditions. One in ten were not accessing any care at all.
People who were shielding had the option to register for support, for example to receive priority supermarket deliveries or other forms of local help. According to the same survey, 13% of people shielding registered to receive support in this way. Among this sub-group registered for support, 38% experienced reduced access to care. The levels of reduced care within this group are concerning, particularly as this is a group that has requested additional support and is known to local services.
The survey also reported that more than one in three people (37%) experienced a decline in their mental health and wellbeing since advised to shield. This was echoed in a survey of older adults using the English Longitudinal Study of Ageing (ELSA) COVID-19 Substudy. This found that those asked to stay at home experienced higher levels of depression, anxiety, loneliness and a reduced quality of life compared with the study population.
This analysis of the open data on the CEV population reveals a concerning lack of access to health services to treat ongoing health conditions and the impact of shielding on mental health. While shielding was intended to protect those most at risk of becoming seriously ill from COVID-19, it is important to recognise that there have been a number of unintended consequences with impacts that will be long lasting. For many it has been life changing.
Unanswered questions about the CEV population
While this data gives some insight into the CEV population and their experiences during the first wave of the pandemic, there are still unanswered questions. Without a deeper understanding of these issues, policies and services cannot be adequately designed and delivered to meet the needs of the shielded population.
Over the next few months, the Networked Data Lab is going to attempt to address some of these unanswered questions by working closely with our five partners and analysing locally linked datasets. More details on our plans can be found in our statistical analysis plan. We will also be sharing our code as we go and publishing our first set of findings before Christmas.
These unanswered questions include:
- What proportion of people have been added to the shielded patient list locally and why were they added?
- How many people were added to the list for multiple health conditions?
- What long-term conditions (other than the reason for shielding) does this group of shielded people have?
- How have these people used health care services previously in the treatment of their long-term conditions?
- How has their use of health care services, including inpatient, outpatient and A&E, changed over the course of the pandemic?
- How many people who were asked to shield had a COVID-19 admission to hospital?
The Networked Data Lab is in a unique position to provide insights into the shielded population to help ensure that this population receives the health and social care it needs for as long as COVID-19 is a risk. The needs of this population must be well understood, and services designed in order to adequately address their needs and to enable participation in society while still ensuring protection from COVID-19.
Further reading
Statistical Analysis Plan
Work with us
We look for talented and passionate individuals as everyone at the Health Foundation has an important role to play.
View current vacanciesThe Q community
Q is an initiative connecting people with improvement expertise across the UK.
Find out more
