Preventable deaths and deprivation
30 May 2019
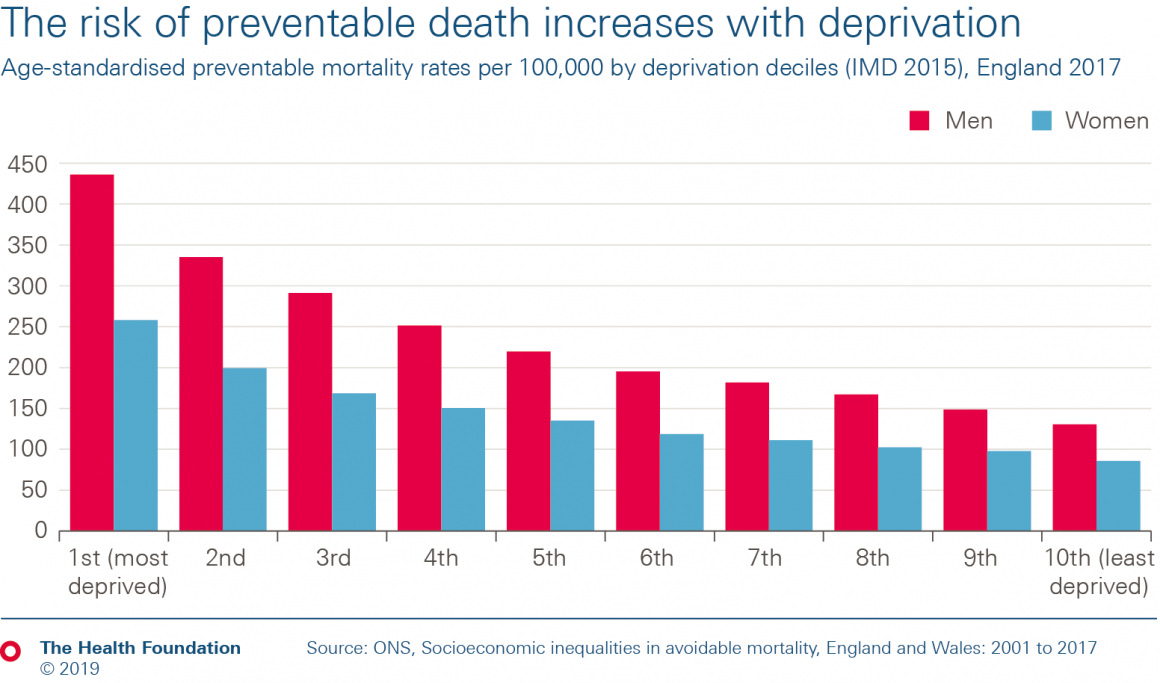
- The risk of preventable death is at least three times higher for people living in the most deprived local areas compared to those living in the least deprived.
- In 2017 there were 436 preventable deaths per 100,000 men in the most deprived 10% of areas, compared to 131 per 100,000 men in the least deprived 10%. And there were 258 preventable deaths per 100,000 women in the most deprived 10% of local areas, compared to 86 per 100,000 women in the least deprived 10%.
- Preventable deaths are those that could be avoided through public health interventions.
In May 2019 the Office for National Statistics published the latest statistics related to avoidable mortality and socioeconomic inequalities. This explores deaths that are considered avoidable in the presence of timely and effective health care (amendable mortality) or public health interventions (preventable mortality).
The data show that the risk of preventable deaths is at least three times higher for people living in the most deprived 10% of local areas compared to the least deprived 10%.
While the preventable mortality rate has fallen since 2001, its fallen at a faster rate for people living in the least deprived local areas. Between 2001 and 2017 it fell by 36% for the least deprived 10% of areas, but only 25% for the most deprived 10% of areas. And while the absolute gap between the most and least deprived has also fallen, the relative gap has grown.
The most common cause of avoidable deaths for men is cardiovascular disease, and for women it is neoplasms (including cancer).
The data reinforce the link between deprivation and health risks. The large gap between the most and least affluent is driven by the conditions in which people live, work and age. These have a direct impact on people's health and can make it harder for people to live healthy lives, resulting in these huge differences in preventable deaths.
Note
- Avoidable deaths are defined as:
- those where it is reasonable to expect deaths to be avoided through good quality health care, even after the condition has developed (amenable mortality)
- those where it is possible to prevent the condition from occurring in the first place (incidence reduction) through wider public health interventions, such as those targeted at reducing the incidence of smoking (preventable mortality)
- The time series uses two different avoidable mortality definitions (2001 to 2013 and 2014 onwards). Therefore rates for the different periods are not directly comparable, but do provide a fair indication of the overall trend.
References
Health Foundation analysis using:
Further reading
Work with us
We look for talented and passionate individuals as everyone at the Health Foundation has an important role to play.
View current vacanciesThe Q community
Q is an initiative connecting people with improvement expertise across the UK.
Find out more
