Job quality How does work affect our health?
- This analysis is part of a collection exploring how work affects health.
- The charts on this page explore trends and inequalities in job quality, with reflection on what these mean for people's health.
The quality of a job can take in a range of different aspects: the nature of the tasks in the job, the leeway available to perform these tasks, support from co-workers and management, pay levels, the presence of workplace hazards, and more.
There have been a number of attempts to measure what makes a good job in recent years, such as the Scottish Fair Work Convention, the London Good Work Standard, or the Measuring Job Quality working group. The latter’s measure of job quality included terms of employment; pay and benefits; health and psychosocial wellbeing; job design and nature of work; social support; voice and representation; and work-life balance. These matter for health to varying degrees.
The focus in this section is on the broader psychosocial environment of work.
Work demands and resources
Work has many demands on people, both physical and psychological, and people may have a range of means to meet these demands (control over them). There are two models looking at job strain: the demand-control model and the effort-reward model. The former has a bidirectional relationship between the demands of the job and the ‘decision latitude’ with which people are able to meet these. Effort-reward compares the effort expended against the rewards, including remuneration and promotion prospects. There are overlaps in the models, though the control they are looking at is task-focused in the first instance and broader in the second.
Imbalances in demand-control or effort-reward create job-strain, which may manifest as being excluded from decision-making, unsupportive colleagues, low promotion prospects, job dissatisfaction and so on. It is associated with a range of negative health effects such as cardiovascular diseases and hypertension, with chronic stress undermining the immune function and increasing susceptibility to a range of conditions. These interact with other factors, such as social support.
Although the demand from jobs can be high across the distribution, the insight of the Whitehall Studies was that control is lower at the bottom of the employment scale. There is some evidence that these models only work in white-collar or service work, with control having little impact in manufacturing, for example.
Insecure work
Job security, or confidence in the continued existence of a job, is considered another stressor with a significant impact on health. Broader definitions include concerns about the loss of particular job functions and individuals’ capacity to resist changes. The psychological challenges posed by uncertainty have been categorised as unpredictability (lack of clarity on how to respond) and uncontrollability (powerlessness towards the threat), the latter of which is considered a key part of the transmission mechanism.
How is job quality associated with health?
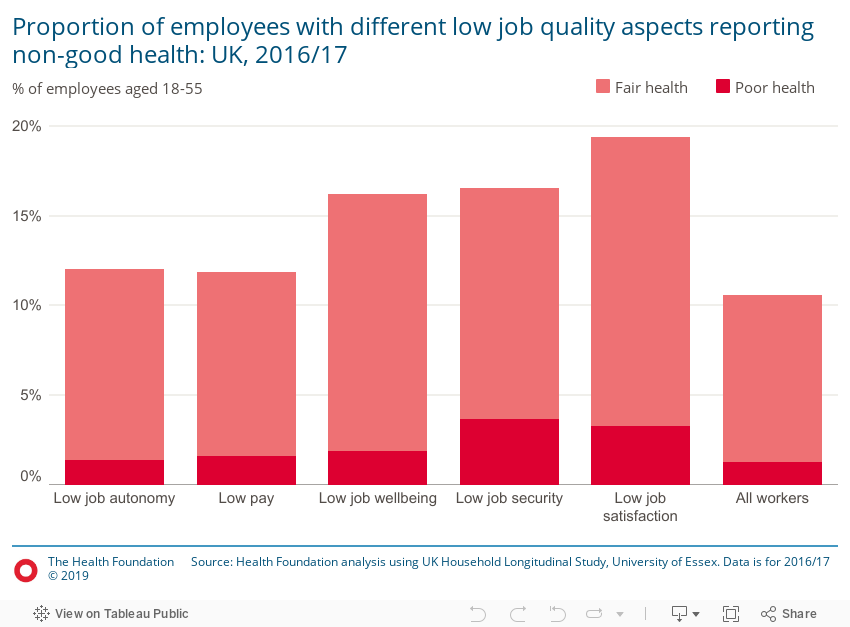
Poor job quality is associated with worse health. 11% of all workers report that their health is less than good. Over twice as many report their health is less than good for some measures of poor job quality, specifically low job security and low job satisfaction.
Why does this matter?
If low quality work is bad for people’s health, then building a policy platform around enforcement, regulation, and other strategies may be required to improve health for the affected groups.
Discussion
In every category, those with a measure of low job quality report having worse health than the average for working-age employees. This is particularly prevalent for low job security and low job satisfaction:
- 4% of people with low job security and 3% of people with low job satisfaction report a 'poor' health status, compared to an average of 1% across all employees.
- 20% of people with low job satisfaction reported their general health as either 'fair' or 'poor', compared to 12% of people with low pay.
- The proportion of people with low job security reporting a 'fair' health status is 4 percentage points higher than the average across all working-age employees.
- The measures of low job quality are based on categories from a University of Manchester study.
- People are rated as having a low score on these dimensions if they: have little or no autonomy on average across five dimensions of work; are in the bottom quartile of pay; report that there job at least some of the time makes them feel depressed, gloomy, or miserable; think it is likely or very likely they will lose their job in the next 12 months; or have little or no satisfaction with their job.
- Health status is reported as excellent, very good, good, fair or poor.
Source: Health Foundation analysis using UK Household Longitudinal Study, University of Essex. Data is for 2016/17.
Why does this matter?
Improving very low-quality work could reap benefits for health outcomes, though how this is done is unclear.
Discussion
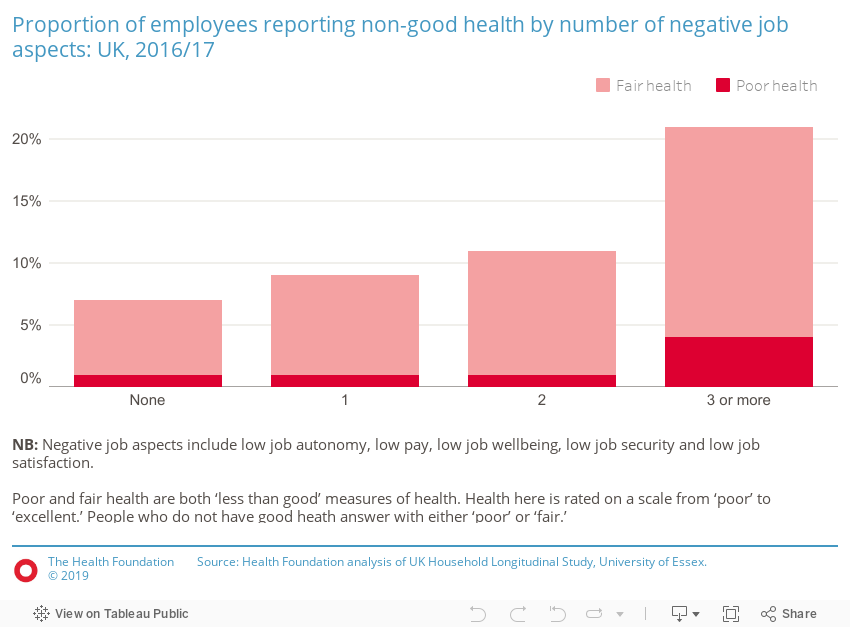
Those reporting their health as 'less than good' increases for each additional adverse job experience for employees. For 0 or 1 adverse job aspects, the proportion reporting poor or fair health is similar, a 7% and 9% respectively. The gradient sharpens for two adverse job aspects (12% poor or fair) and three or more (21% poor or fair).
Except for low pay, the above chart constructs job quality indicators in a similar vein to Chandola & Zhang.
Low quality work is measured as follows:
- Low job satisfaction: employees who report feeling somewhat, mostly, or completely dissatisfied with their job.
- Low job autonomy: across five dimensions of job autonomy, an average score indicating some or a lot of limitation.
- Job wellbeing: across six measures of emotional perceptions of jobs (whether it inspires feelings of tension, unease, worry, depression, gloom, or misery), an average score indicating these feelings some, most or all the time.
- Job security: perception that job loss is likely or very likely in the next 12 months.
- Low pay: below 2/3s of UK hourly median pay.
Source: Health Foundation analysis using UK Household Longitudinal Study, University of Essex.
Why does this matter?
Understanding the type of adverse job quality that is an issue in the UK can help better focus policy and employers to improve the situation.
Discussion
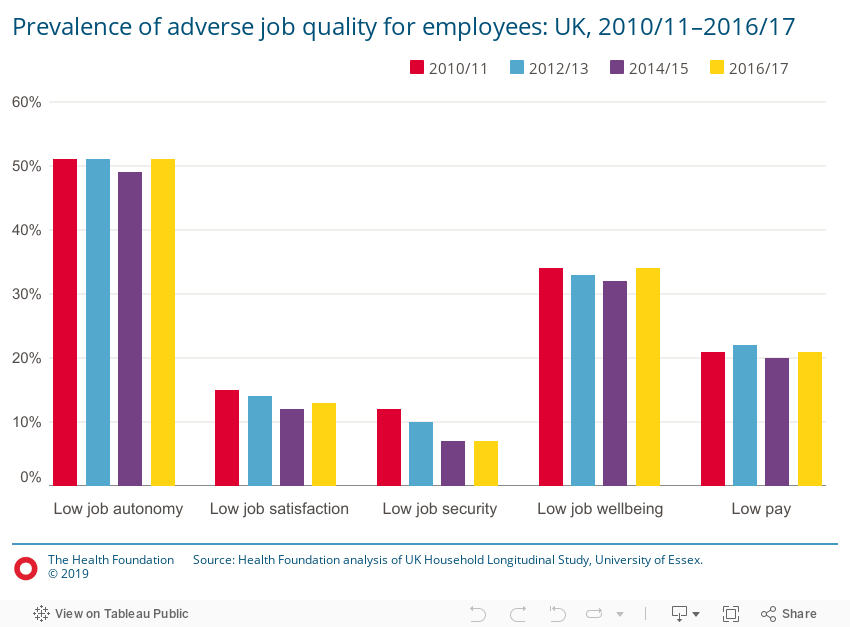
This chart looks at all employees in the UK. The most common form of low job quality measure experienced by UK employees are restrictions on work autonomy, most commonly by having no autonomy over working hours.
The proportion of people within this category has remained flat at around a half over the last six years, currently at 51% in 2016/17.
Low job wellbeing, whereby a job causes an employee some emotional distress at least some of the time, is the second most common adverse quality measure. In 2016/17, around 34% of workers experienced low job well-being.
Low job security has fallen over the course of the last six years, potentially reflecting growth in full-time work in recent years. The rate has dropped from 12.3% in 2010/11 to 6.9% in 2016/17.
Except for low pay, the above chart constructs job quality indicators in a similar vein to Chandola & Zhang.
Low quality work is measured as follows:
- Low job satisfaction: employees who report feeling somewhat, mostly, or completely dissatisfied with their job.
- Low job autonomy: across five dimensions of job autonomy, an average score indicating some or a lot of limitation.
- Job wellbeing: across six measures of emotional perceptions of jobs (whether it inspires feelings of tension, unease, worry, depression, gloom, or misery), an average score indicating these feelings some, most or all the time.
- Job security: perception that job loss is likely or very likely in the next 12 months.
- Low pay: below 2/3s of UK hourly median pay.
Source: Health Foundation analysis using UK Household Longitudinal Study, University of Essex.
Why does this matter?
While employment in the UK has increased, the improvement in job quality has been less marked. The question is how government and other sectors can address low job quality.
Discussion
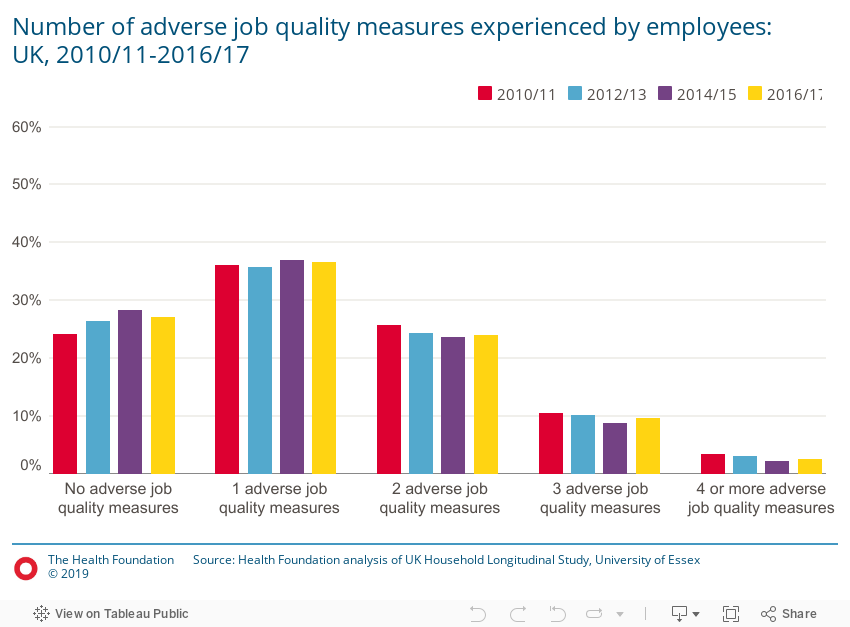
In 2016/17, only around 27% of employees experienced no adverse job quality measures and 37% experienced one negative job aspect. The remaining 36% of employees experienced two or more adverse job quality measures. Around 13% of employees are experiencing 3 or 4 adverse job quality measures, which in particular is associated with worse health outcomes (biomarkers rather than self-rated) when re-entering the labour market from being unemployed.
There have been small improvements in job quality between 2010/11 and 2016/17, although these appear to have stopped between the two most recent waves of data. The proportion with no negative job aspects rose from 24% to 28%, before falling by one percentage point to 27% in the most recent year. The proportion of employees with multiple negative job aspects fell by five percentage points from 40% to 35%, before increasing again by one percentage point to 36%.
Except for low pay, the above chart constructs job quality indicators in a similar vein to Chandola & Zhang.
Low quality work is measured as follows:
- Low job satisfaction: employees who report feeling somewhat, mostly, or completely dissatisfied with their job.
- Low job autonomy: across five dimensions of job autonomy, an average score indicating some or a lot of limitation.
- Job wellbeing: across six measures of emotional perceptions of jobs (whether it inspires feelings of tension, unease, worry, depression, gloom, or misery), an average score indicating these feelings some, most or all the time.
- Job security: perception that job loss is likely or very likely in the next 12 months.
- Low pay: below 2/3s of UK hourly median pay.
Source: Health Foundation analysis using UK Household Longitudinal Study, University of Essex.
Who is most likely to experience low-quality work?
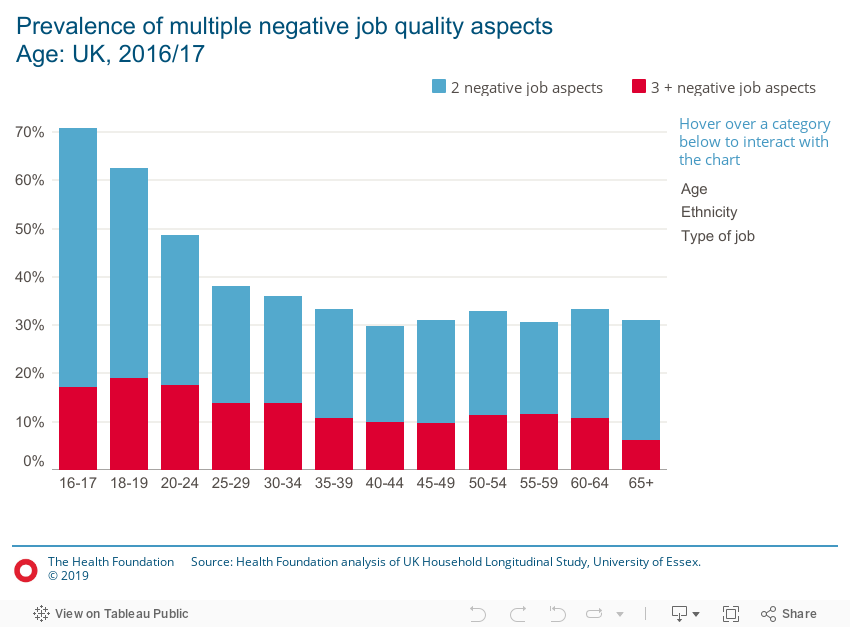
- Age: 43% of young adults aged 18-19 experience at least two negative job aspects and 19% experience 3 or more.
- Ethnicity: 43% of Pakistani/Bangladeshi employees and 45% of mixed ethnicity employees report experiencing two or more negative job aspects, compared to 32% of white British employees.
- Type of job: Close to half of all jobs in semi-routine and routine occupations have multiple negative job aspects, compared to 27% for management and professional occupations.
Why does this matter?
Different groups in the labour market are more likely to experience adverse job quality aspects which means that they are more vulnerable to poorer health outcomes. Can these inequalities be reduced or the consequences mitigated?
Discussion
Age
On average, 22% of employees in the prime working-age population group (25-54) experience at least two negative job aspects and 12% experience three or more. The proportion is much higher for young adults, especially for those aged 18 to 19. Around 43% of employees in this group report at least two negative qualities, and 19% experience even more.
For certain age groups, exposure to negative job aspects could reflect entry-level jobs or those taken to support studying. If these experiences are transient, it may have less in the way of health consequences. But if they are persistent over the life course, this may lead to accumulation of health damage through a persistently negative psychosocial environment.
Ethnicity
There are differences in exposure to low quality work by different ethnic groups. For example, 17% and 18% of employees respectively of Black or mixed ethnicity report experiencing three or more negative job aspects, compared to 12% of white British employees. For two or more negative job aspects, the figures are around 10 percentage points higher for Pakistani, Bangladeshi, Black, and Mixed ethnicity groups relative to White ethnic groups and those of Indian heritage.
The percentage of employees experiencing at least two negative job aspects is highest for Pakistani/Bangladeshi employees (43%), and lowest for Indian employees (31%).
Type of job
The proportion of people reporting multiple negative job quality aspects varies across the different occupation groups. 19% of all management and professional jobs have at least two negative job aspects and 8% have at least three and more. The proportions are much higher for lower-skilled occupations: 32% of all semi-routine and routine jobs have at least two negative job aspects and 8% have at least three and more.
Except for low pay, the above chart constructs job quality indicators in a similar vein to Chandola & Zhang.
Low quality work is measured as follows:
- Low job satisfaction: employees who report feeling somewhat, mostly, or completely dissatisfied with their job.
- Low job autonomy: across five dimensions of job autonomy, an average score indicating some or a lot of limitation.
- Job wellbeing: across six measures of emotional perceptions of jobs (whether it inspires feelings of tension, unease, worry, depression, gloom, or misery), an average score indicating these feelings some, most or all the time.
- Job security: perception that job loss is likely or very likely in the next 12 months.
- Low pay: below 2/3s of UK hourly median pay.
Source: Health Foundation analysis using UK Household Longitudinal Study, University of Essex.
Why does this matter?
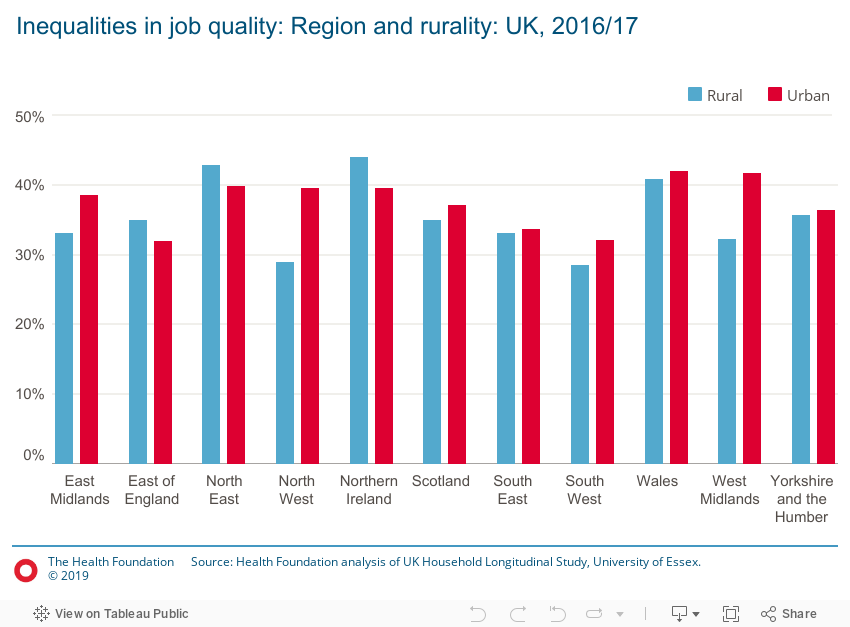
This evidence illustrates the level of inequality across and within different regions in the UK. It shows that employees working in some parts of the country are more prone to experience adverse job qualities, highlighted the need for adequately resourced local strategies.
Discussion
The areas with the lowest proportion of employees reporting multiple negative job aspects are rural areas of the South West and North West of England (less than 30% for both) and London (30%). The areas with the highest proportion of employees reporting multiple negative job aspects are rural Northern Ireland, the rural parts of the North East, and urban parts of both Wales and the West Midlands, all with prevalence above 40%.
This provides some insight into inequalities within regions: in the North West and the West Midlands, the rural areas are relatively prosperous on this measure (29% and 32%) compared to the urban parts of these areas (39% and 42%).
The average proportion of employees with multiple negative job aspects is 37% for urban areas, and 35% for rural areas.
Except for low pay, the above chart constructs job quality indicators in a similar vein to Chandola & Zhang.
Low quality work is measured as follows:
- Low job satisfaction: employees who report feeling somewhat, mostly, or completely dissatisfied with their job.
- Low job autonomy: across five dimensions of job autonomy, an average score indicating some or a lot of limitation.
- Job wellbeing: across six measures of emotional perceptions of jobs (whether it inspires feelings of tension, unease, worry, depression, gloom, or misery), an average score indicating these feelings some, most or all the time.
- Job security: perception that job loss is likely or very likely in the next 12 months.
- Low pay: below 2/3s of UK hourly median pay.
Source: Health Foundation analysis using UK Household Longitudinal Study, University of Essex.
More analysis on work and health
Further reading
Work with us
We look for talented and passionate individuals as everyone at the Health Foundation has an important role to play.
View current vacanciesThe Q community
Q is an initiative connecting people with improvement expertise across the UK.
Find out more
