Average annual costs per patient for the top 5% of patients are over 20 times higher than all other patients
29 October 2019
Key points
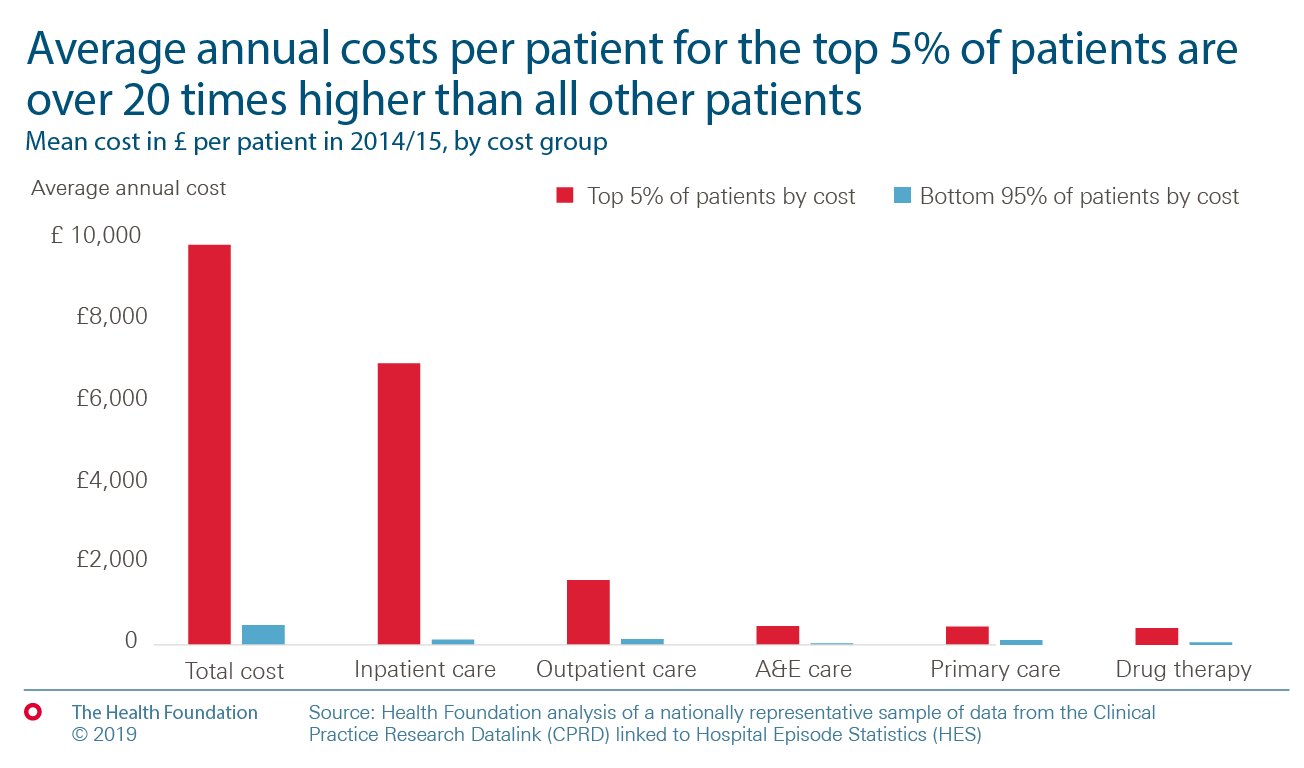
- Analysis identifying the top 5% of users of primary and secondary care services by cost, using a large nationally representative sample in the year 2014/15, found that mean annual costs per patient were over 20 times higher in the top 5% of patients compared with all other patients (£9,789 vs £487).
- This large difference between the high-cost, high-need group and all other patients was primarily driven by the difference in mean costs per patient of inpatient care (£6,892 vs £128) and, to a lesser extent, outpatient care (£1,582 vs £142).
- The design, delivery and management of high-cost, high-need patients have important implications for overall health system costs. Interventions that focus on better managing these patients in primary care and the community, reducing the need for unplanned and costly hospital admissions, could help reduce costs and improve the quality of care.

Despite the increasing financial pressure on the NHS over the past decades, there has been little research to understand the distribution and concentration of health care costs across the population.
A new working paper explores for the first time the distribution of both primary and secondary health care costs in England, including GP-prescribed drug cost. Identifying high-cost, high-need patients and examining the way in which they use health care services might help to design initiatives to reduce costs or to improve efficiency.
The mean costs per patient in 2014/15 by cost group are shown in the figure. The paper finds that the total mean cost per patient in the high-cost, high-need group (£9,789) was 20.1 times higher than the mean cost for all other patients (£487). This large difference between the high-cost, high-need group and all other patients was primarily driven by the difference in mean costs per patient of inpatient care (£6,892 vs £128) and, to a lesser extent, outpatient care (£1,582 vs £142). For inpatient care, the mean costs per patient for the high-cost, high-need group were 53.9 times higher than for all other patients; for outpatient care, they were 11.2 times higher; for A&E care, they were 12.4 times higher; for primary care, they were 3.8 times higher; and for GP-prescribed drug therapy, they were 6.4 times higher.
Further analysis of inpatient care suggested that 9% of the mean cost per high-cost, high-need patient was associated with what could be considered to be an ambulatory care sensitive (ACS) admission and therefore potentially preventable. Within the bottom 95%, 8% of the mean cost per patient could be considered potentially preventable. While the proportions of mean costs per patient are very similar, the total costs associated with potentially preventable admissions are significantly different across the two groups. Approximately £9.7m is spent on potentially preventable admissions in the high-cost, high-need patient group, while only £2.9m is spent on potentially preventable admissions in all other patients.
The design, delivery and management of high-cost, high-need patients have important implications for overall health system costs. Interventions that focus on better managing these patients in primary care and the community, reducing the need for unplanned and costly hospital admissions, could help reduce costs and improve the quality of care.
Further reading
Work with us
We look for talented and passionate individuals as everyone at the Health Foundation has an important role to play.
View current vacanciesThe Q community
Q is an initiative connecting people with improvement expertise across the UK.
Find out more
