Who was advised to shield from COVID-19? Exploring demographic variation in people advised to shield
27 January 2021
Key points
- The shielded patient list has been developed to identify those who are clinically extremely vulnerable (CEV) to severe illness from COVID-19, to help ensure that they have safe access to essential services during the pandemic. Here we present novel data from five partners – Grampian, Wales, north west London, Liverpool and Wirral, and Leeds – in the Networked Data Lab, highlighting the heterogeneity of this group across different areas of the UK.
- There is substantial variation across the partners in the circumstances of people identified as CEV, in terms of neighbourhood deprivation level, rurality and ethnicity, highlighting the different challenges and likely levels of support needed from services.
- There is also variation between partners in the number of people who are identified as CEV via local health services. Understanding the range of local approaches used to identify the most vulnerable will help ensure that all who are potentially at risk are systematically identified and given access to the support services they need.
- Those identified as CEV to COVID-19 are also a clinically heterogenous group of people. Some conditions, such as severe respiratory conditions, are more often seen among people who live in more deprived areas. More work is needed to understand the full range of health needs of this group.
- Those who are CEV to COVID-19 face a wide range of different challenges, and it is important that these differences are recognised to ensure all are able to access the support they need. This is particularly critical now, as many have been asked to shield again and the vaccination programme begins to reach these groups.
Introduction
During the COVID-19 pandemic, the Chief Medical Officers across the UK identified the need to protect people who were defined as clinically extremely vulnerable (CEV) to severe illness from COVID-19, developing a list of people who were advised to ‘shield’ at home. While advice around shielding was relaxed in the summer of 2020, it was reintroduced as COVID-19 case numbers rose in January 2021, and guidance for the CEV continues to be updated across England, Scotland, and Wales. As Professor Chris Whitty has highlighted, there are continued concerns both around the ongoing infection risks for those most vulnerable to COVID-19, but also the economic and mental health consequences of being asked to stay at home and limit contacts; this is why the CEV are an important priority group for vaccination.
The Networked Data Lab
Linked data sets have shown themselves to be a crucial part of the COVID-19 response, allowing services to identify people most impacted by the pandemic and ensure they receive essential support and resources. The Networked Data Lab (NDL) is a collaborative network of analytical teams across the UK, using linked data sets to help tackle the most important health and care priorities, as identified by both those working in the health and care system and engagement with the public.
The NDL’s first topic focuses on those categorised as CEV to COVID-19, as identified through the shielded patient list. This is a group where analysis of linked data sets could provide actionable insights for decision makers. Following on from our chart examining the open data available on the shielded patient list, here we use data from our five partners to describe the CEV population in the following five areas – Grampian, Wales, north west London, Liverpool and Wirral, and Leeds.
Each NDL partner has analysed available linked demographic data on their local population of CEV individuals, defined here as any person who was added to the shielded patient list at any point prior to 31 July 2020. The current shielded patient list for each partner will vary slightly from this, in part because the national criteria for inclusion in the shielded patient list itself continues to be adapted. Our analysis does not attempt to assess the accuracy of this list, to measure the behaviour of individuals who received advice that they should shield, or to evaluate the shielding policy itself. The analytical code used to produce this analysis is available on GitHub, along with the data tables provided by our partners, released as open data.
Local context
As we have previously shown, the percentage of the population identified as CEV varies between areas, which in part likely reflects known health inequalities between regions. Areas where a high proportion of the population are CEV may face challenges in terms of the capacity of services to provide support to those who are at greatest risk from COVID-19. In addition, some areas have been more heavily affected by COVID-19 than others and there has also been variation in the restrictions and guidance in place in different areas across the UK. Table 1 highlights the varying restrictions in place across each of our five areas.
Table 1
NDL partner |
Percentage of population identified as clinically extremely vulnerable |
COVID-19 restrictions in place |
|---|---|---|
Grampian |
2.5% |
23/03/2020 – UK lockdown announced* 29/05/2020 – Scottish roadmap out of lockdown 01/08/2020 – Shielding programme ends in Scotland 05/08/2020 – Local restrictions in Aberdeen City 26/08/2020 – Local restrictions in Aberdeen City lifted 02/11/2020 – Scottish Tier system: Aberdeenshire and Aberdeen City Tier 2, Moray Tier1 15/12/2020 – Aberdeenshire and Aberdeen City Tier 3 26/12/2020 – Mainland Scotland restrictions at Tier 4** 05/01/2020 – Scottish ‘Stay at Home’ order* |
Leeds |
5.3% |
23/03/2020 – UK lockdown announced* 13/05/2020 – English lockdown easing begins 01/08/2020 – Shielding programme ends in England 25/09/2020 – West Yorkshire restrictions 12/10/2020 – Tier 2 restrictions 05/11/2020 – English national lockdown 02/12/2020 – English national lockdown ends, move to Tier 3 05/01/2020 – English national lockdown* |
Liverpool and Wirral |
7.5% |
23/03/2020 – UK lockdown announced* 13/05/2020 – English lockdown easing begins 01/08/2020 – Shielding programme ends in England 09/10/2020 – Tier 3 restrictions 05/11/2020 – English national lockdown 02/12/2020 – English national lockdown ends, move to Tier 2 30/12/2020 – Tier 3 05/01/2020 – English national lockdown* |
north west London |
5.1% |
23/03/2020 – UK lockdown announced* 13/05/2020 – English lockdown easing begins 01/08/2020 – Shielding programme ends in England 05/11/2020 – English national lockdown 02/12/2020 – English national lockdown ends, move to Tier 2 16/12/2020 – Tier 3 19/12/2020 – Tier 4** 05/01/2020 – English national lockdown* |
Wales |
4.2% |
23/03/2020 – UK lockdown announced* 22/06/2020 – Easing of Welsh lockdown begins 16/08/2020 – Shielding programme ends in Wales 08/09/2020 – first Welsh local lockdown implemented in Caerphilly; by 28/09/2020, two-thirds of Wales in local lockdown 23/10/2020 – Welsh ‘firebreak’ lockdown introduced 09/11/2020 – Welsh ‘firebreak’ lockdown ends 23/12/2020 – Welsh alert level 4** |
* Shielding programme in place for clinically extremely vulnerable ** Clinically extremely vulnerable advised not to go to work or schooloutside the home, until further notice |
||
How have people been identified as clinically extremely vulnerable to COVID-19?
To assemble the shielded patient list, a method developed centrally by NHS Digital - with some modifications made to reflect differences in systems in Scotland and Wales - used routine health care data to identify CEV people. Adjustments to this list could be made by local health systems. GPs were also asked to assess individuals who had registered themselves through the government service as CEV.
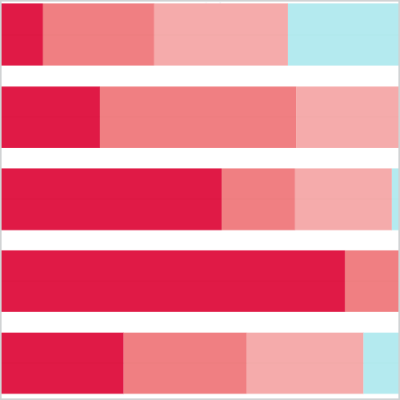
While detail on method of addition to the shielded patient list was not available for all NDL partners, there is substantial variation between the three sites with this data available. In Leeds, the majority (61%) of CEV people were identified by their local health system. This was even higher for those over the age of 80 (71%). In contrast, in Wales, 88% of people were identified by the centrally developed Welsh methodology, with little variation with respect to age.
Figure 1
There are likely to be multiple causes of this variation including:
- different approaches locally to adding people to the shielded patient list
- differences in the demand for additional support, and
- differences in coding practices within health records, leading to variation in who is captured via the centrally developed methodology.
By sharing the approaches, methods and code lists that have been used to build the shielded patient list locally, we can begin to understand the nature of these differences across areas and ensure that all individuals who are CEV have equitable access to the support they need to keep themselves safe during the pandemic. This is critical as the shielded patient list is used by local councils to support delivery of medications and food, provide furlough support for those unable to work during shielding and for vaccine prioritisation.
What do we know about the circumstances of those who are clinically extremely vulnerable?
The type and level of support needed by those who are CEV will vary substantially with social context. Deprivation is one key factor to consider and we show that the percentage of the CEV population that lives in deprived areas varies substantially between NDL partners. Index of Multiple Deprivation data describe the relative deprivation of small areas within each of the devolved nations. Using this data, we can see that 60% of the CEV population in Liverpool and Wirral are living in the most deprived areas in England, but by contrast, in north west London 18% are living in the most deprived areas in England. In Grampian, 8% of the CEV population live in the most deprived areas of Scotland. These differences reflect the general population demographics of each area.
Figure 2
As our Welsh NDL partner draws data from across the nation, rather than within local areas, the interpretation of the data here is slightly different, showing the deprivation level of the CEV relative to the whole Welsh population.
CEV people living in the most deprived areas will generally have fewer resources available to tackle the challenges of shielding. This includes financial resources, suitable housing, access to outdoor space, digital access and transport. Data have also shown that those receiving the lowest pay are also often least able to work from home, meaning that for many people who are both CEV and living in deprived areas, shielding will substantially affect their ability to work. As a result, there is likely to be a greater reliance in these areas on the support for those shielding provided by local authorities. If funding and services are targeted to the deprived communities where they are needed most, this will help to ensure that CEV people living in the most deprived areas are not further disadvantaged by the impacts of the pandemic.
Factors such as whether someone who is CEV is living in an urban or rural context, and their ethnicity, are also likely to have a substantial effect on the challenges they face during the pandemic. Using data on urban and rural geographies relevant to the local area from all five partners, Wales has the highest number of CEV people living in rural areas (32%), while Liverpool and Wirral have the least (less than 1% of those where this geography is known). Urban populations may be more likely to face challenges around access to outdoor space, while rural populations may more often have issues with using broadband to access digital services.
The three NDL partners in England were able share ethnicity data, highlighting the significant variation here as well. While broad categories do not accurately capture an individual’s ethnicity, the data does indicate that north west London serves the most ethnically diverse population: of those with known ethnicity data available, 63% of the CEV population were from black, Asian and ethnic minority backgrounds. In Leeds this was 13% and in Liverpool and Wirral, 10%. This likely reflects the demographic diversity of these different areas. We note there is little variation between partners in the age and sex distribution of the CEV population across partners (a slightly higher percentage of women than men are usually identified as CEV and approximately four in 10 are over the age of 70).
Nevertheless, it is clear from this data that people who are CEV are a diverse group. Contextual information on this diversity at a local level can help services to work closely with the local communities they serve, ensuring that services are provided in a way that is adaptable to the various needs of those requiring support.
What are the medical reasons for this vulnerability to COVID-19?
While people identified as CEV to COVID-19 have often been considered as a single population during the pandemic, this is a clinically heterogeneous group of people. This currently includes eight disease groupings in England, seven in Scotland and Wales. There are some differences in the data recording practices of each of our NDL partners, including the percentage of people where a reason for shielding was available. Focusing on data from Wales and Grampian, who have largely complete data on the reason for shielding, the most common that could be identified are:
- severe respiratory conditions
- taking immunosuppressants
- cancer, and
- rare diseases.
Each category of conditions shows a distinct profile by level of deprivation, and these patterns are very similar across both NDL partners.
Figure 3
Severe respiratory conditions (including severe asthma, severe COPD and cystic fibrosis) are more prevalent in the most deprived areas, consistent with the known association between deprivation and respiratory conditions. We know that there is a strong seasonal impact for those with severe respiratory conditions, with winter associated with a doubling of respiratory-related hospital admissions. Those asked to shield because of respiratory conditions may now need additional help as compared with the initial shielding period from March to July 2020.
There is no strong relationship between level of deprivation and the prevalence of rare diseases (here, this category includes ‘people with rare diseases and inborn errors of metabolism that significantly increase the risk of infections (such as SCID, homozygous sickle cell)’), but both the specific cancers identified as making individuals extremely vulnerable to serious illness from COVID-19 and immunosuppressant therapy sufficient to increase the risk of infection were more prevalent reasons for shielding among the CEV in less deprived areas.
Using the available demographic data to understand how social context intersects with clinical need for CEV people is important to ensure the NHS is able to plan services which support the specific needs of their patients.
But there is little consistent data available on other conditions the CEV may require care for, including whether they have more than one of the conditions associated with extreme clinical vulnerability. Without this information, local health services are unable to develop a comprehensive view of the types of health services that this group of people may require to manage their other long-term conditions.
Conclusions
Examining demographic data from NDL partners across the UK, we have highlighted that those who are CEV to COVID-19 are not a homogenous population. There are substantial differences between partners in how people have been added to the shielded patient list, as well as variation in the composition of the CEV population in terms of level of deprivation, rurality and ethnicity. A transparent approach, sharing and understanding the context of these differences, can inform local responses and the services they deliver to support the needs of those who have now been asked to shield once more. This is particularly important as the shielded patient list is used to target COVID-19 vaccine prioritisation and provide furlough support where appropriate to those who are CEV.
We also indicate the level of clinical heterogeneity among those categorised as CEV, but there are substantial questions outstanding about the health needs of this population. The Networked Data Lab plans further analysis using linked secondary care data to develop both a better picture of the health needs of these CEV individuals and highlight care which may have been missed during the initial shielding period between March and July 2020. This will provide valuable insight to assist with service planning in 2021 as infection rates and demand for hospital care increases. These data will also point to where health and care systems should plan for high levels of delayed need going forward for those who are currently at very high risk of serious illness with COVID-19.
This chart was co-authored by the team members of the five NDL partners, led by Alisha Davies (Wales), Jessica E Butler (Grampian), Roberto Fernandez Crespo (NW London), David Knowles (Liverpool and Wirral) and Frank Wood (Leeds).
Each partner contributed to the development of the statistical analysis plan for this work, curated and analysed the data from their own area and reviewed this description of the work. Further detail can be found on GitHub.
Further reading
Work with us
We look for talented and passionate individuals as everyone at the Health Foundation has an important role to play.
View current vacanciesThe Q community
Q is an initiative connecting people with improvement expertise across the UK.
Find out more
