The ‘good health’ gap: what will it take to reduce health inequalities?
24 July 2019

The prevention green paper – and what it did and didn’t include – should not get lost among the flurry of last-ditch policy announcements made before the new Prime Minister took office. While the paper recognised that health should be treated as an asset to be invested in over the lifetime, it fell well short of providing the strategic, long-term, preventative approach to creating the conditions that allow people to lead healthy lives.
A key part of the paper is its support of the ongoing government commitment to increase the years we spend in good health by an average of 5 years, while narrowing the gap between the experience of the richest and poorest, by 2035. This target forms one of the government’s Ageing Society Grand Challenge missions launched as part of its Industrial Strategy, as well as being a key focus of the prevention green paper released this week.
The government’s preferred metric is disability free life expectancy capturing the years a child born today can expect to live without a limiting health condition. However, there is a case for also targeting a similar, but broader measure that captures good health more generally – healthy life expectancy.
At the moment, according to data from the Office of National Statistics, a girl born in the least deprived 10% of local areas can expect to live 70.4 years in good health, but she would live only 52.0 years in good health if born in the most deprived 10% of local areas – an 18.4-year gap. That’s a difference of almost two-decades in the years of life spent in good health. The pledge to reduce this gap is welcome but challenging: our analysis shows it could take rather more than 16 years, and perhaps as much as 75 years, to achieve this increase.
Warning signs of stalling progress
Even with the whole government behind this goal, the context for closing the gap in years spent in good health is challenging. The historical improvements in life expectancy we have come to expect have stalled in recent years, and it's even fallen for some groups, such as women in the most deprived 10% of local areas in England. Other signs of trouble ahead include rising child obesity among school children in Year Six (10–11 year olds), driven by increasing obesity rates for the most deprived 10%. There is also a rising prevalence of mental health conditions, particularly among teenagers.
The number of years we spend in good health is improving even more slowly than the total years we can expect to live. Disability free life expectancy has deteriorated since 2009–11, as has healthy life expectancy for women. For men, there has been some very slow progress – healthy life expectancy at birth for men in the UK increased by only 0.4 years between 2009–11 and 2015–17.
Taking those recent rates of improvement for men, healthy life expectancy will rise by just over a year by 2035. It would take 75 years to boost the average number of years that men spend in good health by 5 years. At that rate of improvement, a similar time period would apply whether measured by disability free life expectancy or healthy life expectancy.
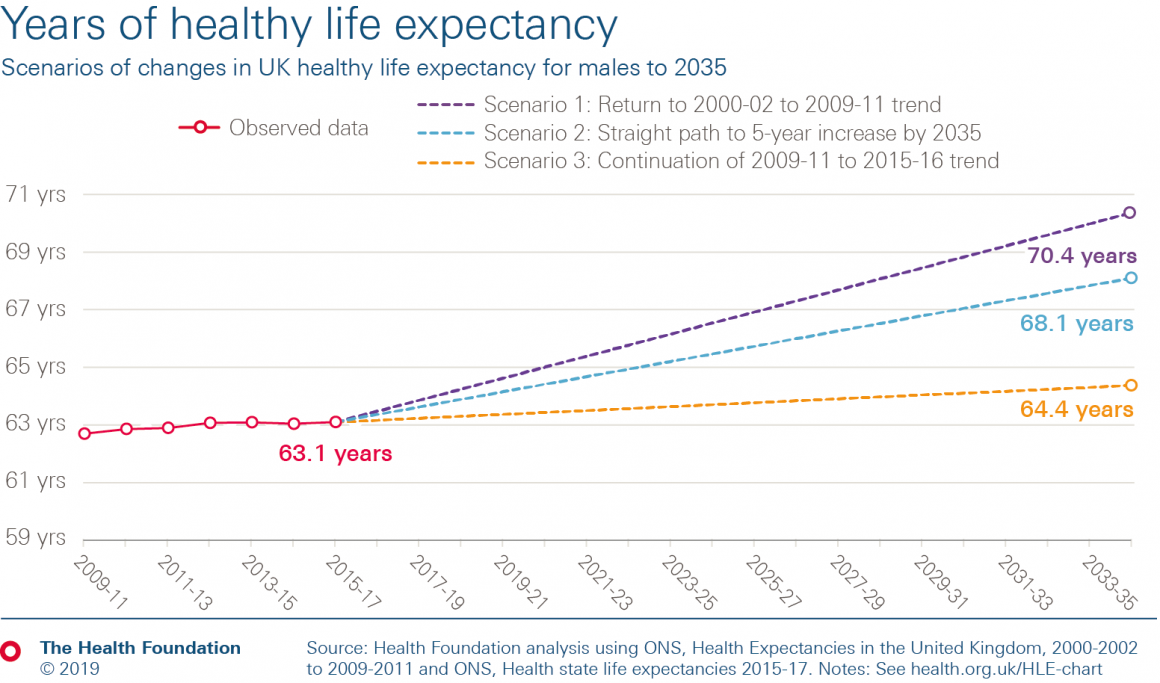
Of course, recent years are not necessarily predictive of the future. The 2000s saw healthy life expectancy improving at a rate that, if returned to and sustained to 2035, would put the government on track to more than meet their target of a 5-year boost to healthy life expectancy.
Clearly there is significant uncertainty as to what future trends in healthy life expectancy may be. But we shouldn’t overlook the sharp shift in the pattern in healthy life expectancy improvements since the turn of the decade, something that demands closer attention and examination.
Reducing inequalities in healthy life expectancy
Rightly, the government’s mission is not just about absolute increases, but reducing inequalities too. That’s important because of the wide – more than 18-year – gap in healthy life expectancy between the 10% most and least deprived areas. Reducing this gap could boost the average and help fulfil their ambition.
Improvements in healthy life expectancy have also varied, and have reversed for some groups. Within areas with similar levels of deprivation, there is wide disparity in outcomes. This suggests the right policy mix can help drive improvements (even accounting for existing conditions).
Prevention: government priorities (and parameters)
So where should the government start if they are to boost the nation’s health and make credible the long-term aim of treating our health as an asset?
The shift in the policy narrative towards recognising health as asset is welcome, but it needs to be backed by a shift in investment. For much of this decade, many of the other areas of spending that create good health, and sit outside of the NHS, have seen major funding cuts. Paying more attention to the long-term consequences of any fiscal settlement on health will be key.
One area to watch is the public health grant, which plays an important role in improving and maintaining the population’s health. Real term, per capita funding of the grant is set to fall by 25% between 2015/16 and 2020/21. Halting this trend is a crucial place to start, but other government areas, such as social security, are important too.
Naturally, it is the conditions in which we live that are the strongest determinants of our health – as my colleagues have explored in What makes us healthy?. Improving these conditions requires the right blend of regulation, ‘polluter pays’-style tax design, and provision of information. With such a wide range of factors influencing health, cross-government and cross-sector action is vital. Ensuring effective change and embedding a health focus in all government decision-making will require more than rhetoric.
One possibility is a legislative commitment to improving health. This approach is already in place in Wales through the Future Generations Act, and is currently being mooted by Labour. Another move could be to widen key government metrics of success to include indicators of health, wellbeing and our wider prosperity (not just GDP-based measures) – as New Zealand’s first Wellbeing Budget does. Whatever the mechanism, embedding long-term decision-making at the heart of government is key.
There are clear limits on what central government can achieve alone. With the places we live in so key to our health, recognising the role of local governments to find the right interventions at a regional level is important. It’s also crucial to reach beyond government: involving communities in creating activity to support their health; and ensuring businesses support the health of their employees and consider the wider contribution they can make to health.
Every sector needs to treat our health as an asset that underpins our prosperity. A comprehensive shift in approach is needed to create healthier lives for people in the UK – it will need a bold approach from the new Prime Minister and his government.
David Finch (@davidfinchRF) is a Senior Fellow at the Health Foundation.
Notes
- Definitions of healthy life expectancy changed over the period 2001–11. The analysis takes the longest most recent consistent time series available (from 2009–11) and applies the historic proportional change in HLE between 2000–02 and 2009–11 for our upper-case scenario.
Further reading
Work with us
We look for talented and passionate individuals as everyone at the Health Foundation has an important role to play.
View current vacanciesThe Q community
Q is an initiative connecting people with improvement expertise across the UK.
Find out more
