-
In the areas in Great Britain where low-pay prevalence is highest, one in three jobs is low paid.
-
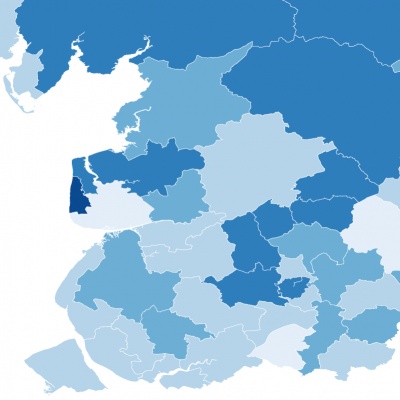
The 10 areas with the highest proportion of low-paid jobs are spread throughout Great Britain, but seven of these are coastal areas.
The map shows the proportion of jobs that pay below two-thirds of UK median gross hourly pay (a common measure of low pay) in each local authority in Great Britain. In the UK, gross hourly median earnings are £13.68 and jobs earning less than two-thirds of median earnings (£9.12) are defined here as low paid.
Decent pay is a sign of good quality work and fair compensation for effort. Low-quality and unrewarding work can be a source of stress, which can harm health.
- In Boston, the area with the greatest prevalence of low-paid jobs in Great Britain, one-third (33%) of jobs are low paid. Blackpool follows closely behind, with 32% of jobs being low paid.
- In other coastal areas, such as Portsmouth, Gwynedd, Rother, North Devon, Hastings and Scarborough, over one-quarter (25%) of jobs are low paid.
- Urban areas, such as Leicester and Middlesbrough, also have over one-quarter (25%) of jobs being low paid.
- The areas with the greatest prevalence of low-paid jobs are spread throughout Great Britain, but there is a concentration of areas with a high proportion of low-paid jobs in South West England.
- The map shows that low-paid jobs are less prevalent in London, and areas extending to the north and west of London. Richmond-upon-Thames has the smallest proportion of low-paid jobs (9%). Outside London, the area with the smallest proportion of low-paid jobs is East Renfrewshire in Scotland.
Increases in the minimum wage and the introduction of the national living wage have improved levels of pay across Great Britain, but the differences in the prevalence of low-paid jobs between areas highlights that some areas have larger challenges to face. The 2021 Chief Medical Officer’s report found that coastal areas face large health challenges, and this map shows the extent of their related economic challenges.
- This analysis uses decile values from the Office for National Statistics’ Annual Survey of Hours and Earnings (ASHE) and assumes that earnings are evenly distributed across deciles.
- Gross hourly pay is payment before tax, National Insurance or other deductions, and excludes payments in kind.
- Median earnings represent the exact middle point in a sample of employee job records taken from the HMRC pay as you earn systems for the ASHE.
- Figures for the City of London and the Isles of Scilly are not included because data are missing, or statistically unreliable.
Source: Health Foundation analysis of the Office for National Statistics, Annual Survey of Hours and Earnings 2020