Trends in distance travelled by transport mode
1 November 2023
Key points
- Both the average and total distance travelled fell drastically in 2020 compared with the previous years as a result of the COVID-19 pandemic. The distance travelled increased in 2021, but did not recover to pre-pandemic levels.
- Prior to the pandemic, the average distance travelled per person in Great Britain had increased from 4,400km per person in 1952 to 13,000km per person in 2019. The total distance travelled in Great Britain increased from 218 billion kilometres in 1952 to 831 billion kilometres in 2019.
- In 2019, private transport (car, van, motorcycle and taxi) accounted for 84.6% of the total distance travelled, compared with just 30% in 1952. In 2020, that figure rose to 92.7%.
Transport can affect health both directly and indirectly, through its relationship with the wider determinants of health. The four main aspects of transport that affect our health are active travel (walking or cycling), air and noise pollution, road safety, and enabling social and economic participation and access to public services.
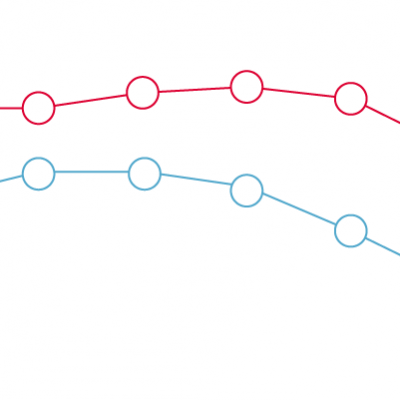
This chart shows the distance travelled by different modes of transport between 1952 and 2021 in Great Britain. These are expressed as the total number of kilometres and kilometres per head, to account for population change.
- There has been a huge rise over time in travelling by private vehicle. In 1952, people travelled 218 billion passenger kilometres a year and 30% of this distance was attributed to travel by private vehicle. By 2019, this had risen to 84.6%, then up to 92.6% in 2020 as a result of the COVID-19 pandemic.
- Between 1990 and 2019, the passenger distance travelled by rail increased from 40 billion kilometres to 80 billion kilometres. It fell sharply as a result of the pandemic.
- Between 1952 and 2019, the distance travelled by bus declined from 92 billion kilometres to 33 billion kilometres, and the distance travelled by pedal cycle declined from 23 billion kilometres to 6 billion kilometres.
- Between 2019 and 2020, distance travelled by bus fell by 58%, while distance travelled by pedal cycle increased by 46%.
Preference for travelling by private transport can lead to underinvestment in other forms of transport, which in turn can restrict the mobility of people without access to private transport. The planning of infrastructure and new developments should support a fairer, greener and healthier transport system.
- Private transport includes: cars, van, taxi and motorcycle.
- Rail includes: national rail, underground and tram.
Source: Health Foundation analysis of Department of Transport, National Travel Survey (NTS), 1952 to 2021; Office for National Statistics, Estimates of the population for the UK, England, Wales, Scotland and Northern Ireland, 1952 to 2021.