Difficulties in job searching due to problems with transport
1 November 2023
- In 2018, 18.5% of unemployed people in England either turned down a job or decided not to apply for a job due to transport-related problems.
Problems with transport can prevent people accessing things that contribute to good health. Transport problems can limit job opportunities and income potential, and mean people are unable to access services, amenities or opportunities for social participation and cultural activities.
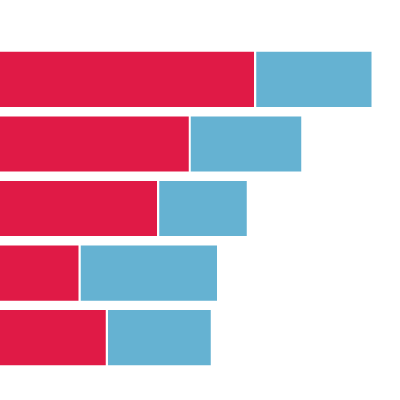
This chart shows the share of people who have turned down a job or decided not to apply for a job in the past 12 months due to problems with transport, split by economic status (in work, out of work, and out of work and actively seeking a job), age and region.
Transport-related problems in 2018 were not experienced equally across the population.
- 18.5% of unemployed people in England either turned down a job or did not apply for a job due to transport problems, compared with 6% of people who were already in employment.
- Younger people were more likely to be disadvantaged by transport problems. The figure was highest for people aged 21–29 years (8.7%) and lowest for people aged 50–59 years (3.1%).
- There were noticeable geographical variations: 7.5% of people in the South West and only 3.1% of people in the West Midlands reported that transport affected their decisions about what jobs they could accept or apply for.
Employment prospects often depend on the quality and affordability of public transport, as well as the location of jobs relative to where people live. A mix of policy interventions is needed to better support people to find and stay in work, including improved transport availability.
- Transport problems include long commuting times, congestion, lack of information, poor connections, and unreliable and expensive transport services.
- Please note the question asking respondents if they had turned down/decided not to apply for work is not available within all iterations of the National Travel Survey. The most recent data currently available is the 2018 National Travel Survey.
Source: Health Foundation analysis of Department of Transport, National Travel Survey (NTS), 2018.