Key points
- Household income (after housing costs) has grown for all levels of income since 2002/03, but has grown the least for the 10% of households on the lowest incomes (the bottom income decile).
- Between 2008/09 and 2020/21 household incomes (after housing costs) for the 10% of households on the lowest incomes were lower than in 2002/03.
- Growth in household income was the strongest for the 2nd to 5th income deciles at 23.1%, but was weakest for the lowest income decile at just 4.5%.
Inadequate income can be a source of stress and limit people’s access to goods, services and social activities, which are all necessary for good health.
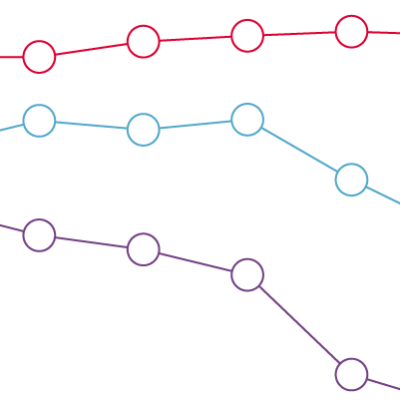
This chart shows the growth in household incomes since 2002/03, measured after housing costs and equivalised to take account of household size, grouped by income deciles:
- Income growth between 2002/03 and 2021/22 was strongest for households in the 2nd to 5th income deciles (23.1%), followed by the 10% of households with the highest incomes (20.9%) and the 6th to 9th income deciles (18.7%).
- 2002/03 to 2004/05: income grew across all deciles. Income growth was largely progressive over this period, as it was strongest for people on lower incomes.
- 2004/05 to 2009/10: income continued to grow for all but people in the bottom 10% of incomes. In 2004/05, income for the poorest households had grown 5% since 2002/03, but by 2009/10 it had declined to the extent that there was a decrease in incomes since 2002/03 of -1.6%.
- 2009/10 to 2013/14: with the recession, incomes declined across the whole distribution.
- 2013/14–2019/20: rising employment rates led to economic recovery and subsequent income growth across most of the income distribution, with the exclusion of people on the lowest 10% of incomes, which remained stagnant and still below 2002/03 income levels
2019/20–2021/22: The lowest 10% of household incomes saw rapid growth over this period – from -1.5% to 4.5% – which is likely due to benefit uplifts during the COVID-19 pandemic.
- Years shown are the final year of a 3-year pooled average, e.g. 2002/03 is a 3-year pooling of 2000/01, 2001/02 and 2002/03.
- Income is equivalised, which means it is adjusted for household size to reflect economies of scale. For example, a household of four needs more income for the same standard of living as a household of one, but not four times as much.
- Housing costs are deducted from income, to reflect that people with lower incomes in particular have fewer options for meeting their housing costs, relative to their income.
- The data is presented as percentage growth compared to a 2002/03 baseline.
- The 2nd to 5th household income deciles and 6th to 9th household income deciles have been grouped together to simplify the chart and make it easier to interpret. However, each of the 2nd to 5th deciles follow similar growth trends over the period covered by the chart and no information has been lost. The same is true for the 6th to 9th deciles.
- Data for 2020/21 is not included in line with the Department for Work and Pensions’ guidance related to data quality during the COVID-19 pandemic.
- 2021/22 data have been affected by the pandemic and are subject to additional uncertainty. They should be viewed with caution and in line with broader trends.
Source: Health Foundation analysis of Department for Work and Pensions, Households Below Average Income, UK, 2000/01 to 2021/22